

Smartphones have become a primary gateway for consuming political news, but we know little about what individuals actually see on their phones. In new research, Guy Aridor, Tevel Dekel, Rafael Jiménez Durán, Ro’ee Levy, and Lena Song open the smartphone black box using novel content data and document individuals’ exposure to election-related content during the 2024 presidential election, as well as the drivers of this exposure.
Having a well-informed electorate is key for a healthy democracy, and smartphones have become the main gateway to political information: most Americans now report that their first exposure to news in the morning occurs on their smartphones rather than on television, newspapers, or desktop computers. Campaigns have adapted accordingly. During the 2024 United States election cycle, candidates and political groups spent billions of dollars on digital advertising, much of it aimed at smartphone users through news apps, email, and social media.
This technological shift could, in principle, make it easier for citizens to access information during elections, with relevant news available at their fingertips. At the same time, the prevalence of other content may crowd out digital news consumption, and individuals may be more likely to encounter information from unvetted sources on their phones, particularly through social media applications. This raises a natural question: how much election-related content do Americans actually see on their phones?
In a new paper, “Digital News Consumption: Evidence from Smartphone Content in the 2024 U.S. Elections,” we provide the first comprehensive answer to this question using novel smartphone content data covering the weeks leading up to the election. The results challenge the view that Americans are heavily exposed to political content during elections, but confirm some concerns about the quality of political information in the digital age.
The median American sees very little election content
Despite the importance of the 2024 U.S. election cycle, we find that the median level of exposure to election-related content for Americans—whom we’ll refer to as the median American—was strikingly low.
On an average day during the presidential campaign cycle, the median individual saw the names of the candidates—Donald Trump, Joe Biden (who dropped out on July 21), and Kamala Harris—for a total of just three seconds. Exposure to members of Congress was even rarer, at 0.4 seconds. Overall, the median individual saw election-related content for 21 seconds each day. Across all apps combined, the median person encountered roughly half as many election-related keywords in an entire day as appear in a single New York Times article about the election. Even during the campaign, the median individual was exposed to content about sports and entertainment ten times more often than content about politicians.
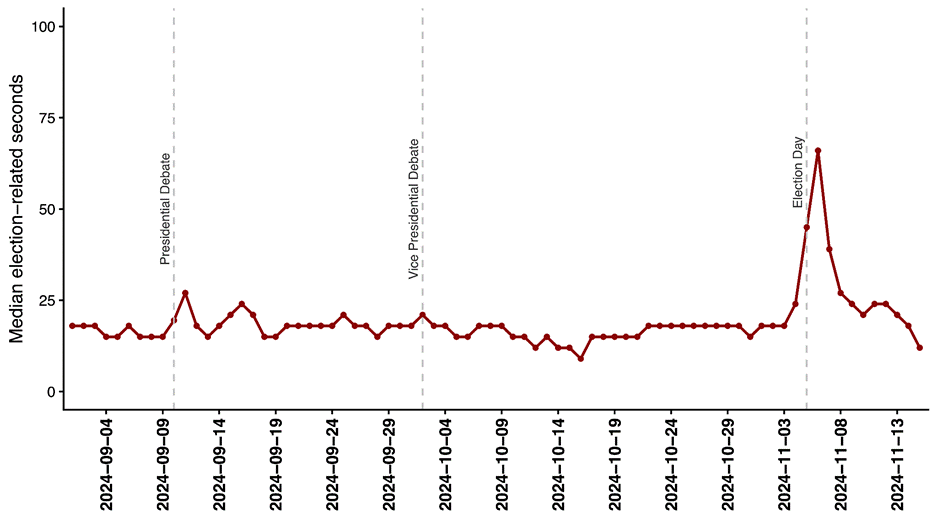
Perhaps more surprisingly, this low level of exposure barely changed over the course of the election cycle. As Figure 1 shows, outside of two exceptional moments—the one presidential debate between Trump and Harris and election day itself—exposure to election content was remarkably flat throughout the campaign. Even in the weeks leading up to the vote, most Americans were not gradually “tuning in.”
Figure 1. Election-Related Exposure in Seconds Over Time
News apps play a minor role
Where does the election-related content people do see come from? As Figure 2 shows, fewer than five percent of exposure to election-related content occurred on news apps like those run by the New York Times, CNN, or Fox News, or those that pull from multiple news sources, like Google News and Apple News, where professional journalists and editors curate content.
Instead, most exposure occurred through non-traditional sources, mostly from social media platforms (e.g., Facebook, TikTok, Instagram, and X), and video and music apps (e.g., YouTube and Spotify). These platforms do not have a formal editorial process determining which content gets prioritized. Instead, a combination of algorithms and user choices dictates the content that people see.
This shift in consumption matters. It means that understanding political exposure today requires looking beyond news outlets, as often done in the literature, and focusing on the broader digital ecosystem.
Figure 2. How people experienced electoral content by source category and app
A) Categories
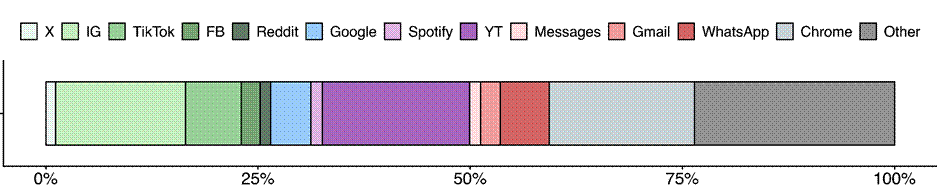
B) Apps
Exposure is extremely unequal
While the median American sees little election-related content, this average masks substantial inequality. Individuals in the 90th percentile of exposure consumed more than 50 times as much election-related content as those in the 10th percentile (17.5 minutes compared to 21 seconds).
What explains this gap? Two factors matter. First, individual characteristics play a role. People living in swing states experience 88% more exposure to election-related content than those in non-swing states, consistent with targeted campaigning. Second, apps matter. As Figure 3 shows, some platforms, such as X, expose users to much higher levels of election-related content than others, such as Facebook and Instagram. These differences align with public reporting suggesting that platforms have made divergent choices about how prominently to surface political material.
Figure 3. Systematic Differences in Content Exposure Across Social Media Platforms
While these differences could, in principle, reflect either platform prioritization or the fact that individuals use different apps for different purposes, several pieces of evidence suggest that platform prioritization plays a role. For example, exposure to specific figures who appeared often in electoral news, most notably Elon Musk, is dramatically higher on X than on other platforms, a pattern not observed for comparable figures elsewhere. For example, Mark Zuckerberg did not appear more often in electoral news on his platforms, Facebook and Instagram. Additionally, supplementary survey evidence shows that many X users report feeling over-exposed to political content, suggesting that elevated exposure reflects platform choices rather than users actively seeking out more politics.
Still, when we formally decompose the sources of exposure inequality, individual differences dominate over systematic differences across apps. Even within the same apps, different users experience vastly different levels of political content, indicating that smartphones tend to mirror, and in some cases amplify, pre-existing differences across individuals.
Opening the smartphone black box
Why do these findings matter? First, they challenge our prior assumption of how much election-related content Americans actually encounter. When we asked experts to indicate how much of this content individuals are exposed to daily, the median guess (45 minutes) was substantially higher than the observed exposure (21 seconds) for the median individual. Most people are just not that exposed to political content, and this was true even during the consequential 2024 election.
Second, the findings show that focusing only on news consumption on traditional outlets misses much of modern political exposure. The key action is happening on platforms not traditionally thought of as “news” sources.
Finally, the results have implications for debates about political polarization, misinformation, and the role of algorithms. Smartphones have not leveled the informational playing field. Instead, they seem to reflect or amplify disparities between the politically engaged and the politically disengaged.
Author Disclosure: The author reports no conflicts of interest. You can read our disclosure policy here.
Articles represent the opinions of their writers, not necessarily those of the University of Chicago, the Booth School of Business, or its faculty.
Subscribe here for ProMarket’s weekly newsletter, Special Interest, to stay up to date on ProMarket’s coverage of the political economy and other content from the Stigler Center.