






In new analysis, Madhav Parikh examines how competition among banks in the United States shapes the way monetary policy reaches depositors. Tracking U.S. banks from late 2021 through mid-2026, he finds that banks in more concentrated local markets repriced their deposit interest rates less than banks in competitive markets, both as the Fed raised rates and as it cut them.
The United States Federal Reserve sets a target range for the federal funds rate, but depositors do not all receive the same interest rate on their interest-bearing deposits. During the latest monetary tightening cycle that began in spring 2022, banks exposed to higher levels of competition raised what they effectively paid on interest-bearing deposits more than banks operating in more concentrated markets. An overlooked feature of monetary policy is that concentration in the banking market can influence how strongly a change in interest rates travels through the financial system.
The difference was almost nonexistent before the tightening began. In late 2021, when the effective federal funds rate was close to zero, the gap in effective deposit rates between banks in the most competitive and most concentrated markets was essentially zero. By mid-2024, when the effective federal funds rate averaged 5.33 percent, the gap had widened to roughly 30 to 35 basis points (0.3-0.35%). As the Fed subsequently eased policy, it narrowed to roughly 24 basis points by mid-2026.
That matters for more than the interest households earn on their savings. Deposits are a central source of funding for banks, meaning differences in how deposit rates respond can also change how monetary policy affects banks’ funding costs. If banks facing stronger competition adjust deposit rates more aggressively when the policy rate moves, then banking competition is not simply a consumer-protection or antitrust concern. It is part of the machinery through which monetary policy is transmitted.
The competition gap
To examine this relationship, I combined U.S. bank call reports, which provide a bank’s financial details, the Federal Deposit Insurance Corporation’s summary of deposits, which track deposit distributions across all FDIC-insured bank branches, and the effective federal funds rate into a dataset containing 91,105 observations from the third quarter of 2021 through the second quarter of 2026. I used the call reports to estimate each bank’s effective rate on interest-bearing domestic deposits, based on its reported deposit interest expense and deposit balances. This is not the advertised rate on a particular savings account. Rather, it measures what a bank effectively pays across its interest-bearing domestic deposit base. The two can differ because advertised rates apply to a particular deposit product, while the effective funding rate reflects the average cost across a bank’s existing stock of interest-bearing domestic deposits. I then used FDIC deposit data to calculate market concentration within each county and construct a bank-level measure by weighting those local concentration levels according to where each bank holds its deposits.
Figure 1 shows how sharply the difference emerged as monetary policy tightened. In each quarter, I compared the median effective deposit funding rate of banks in the bottom and top quartiles of the concentration measure. The gap was effectively zero in late 2021, widened to around 19 basis points by the end of 2022, and generally remained around 30 to 35 basis points from 2023 through the first half of 2024. For perspective, a 35-basis-point difference would amount to $3.50 a year on a $1,000 balance, if that difference were passed through completely to the depositor. As the Fed subsequently eased policy, the gap narrowed but remained about 24 basis points by the second quarter of 2026.
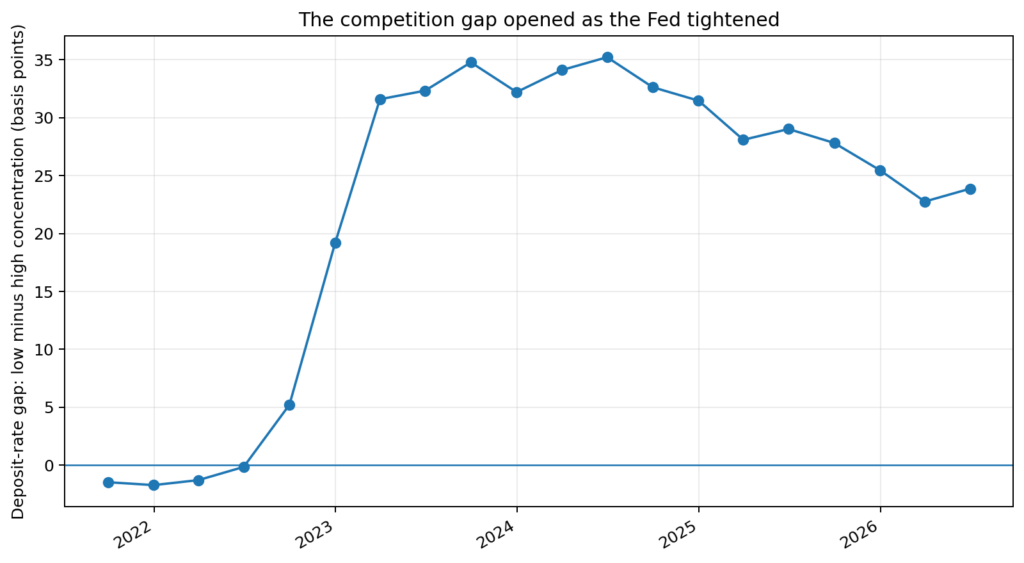
Note: The figure shows the difference between the median effective deposit funding rate of banks in the bottom and top quartiles of the concentration measure. Positive values indicate higher effective deposit funding rates among banks operating in less concentrated markets.
Source: Calculations using FFIEC Call Reports, FDIC Summary of Deposits, and Federal Reserve Bank of New York data.
One interpretation is that competition becomes more important when the opportunity cost of leaving money in a low-paying deposit account rises. When market rates are close to zero, depositors have little additional yield to gain by moving their money to another bank, giving banks relatively little reason to compete aggressively on rates. Once policy rates rise substantially, higher-yielding alternatives become more attractive, and banks face greater pressure to retain deposit funding. Banks operating in more competitive markets may therefore have to pass through more of the policy-rate increase to depositors, while banks in concentrated markets face less pressure to do so. This interpretation is consistent with existing research on how bank interest rates respond to monetary policy and banking competition, although this evidence by itself does not establish which mechanism is responsible.
Figure 2 shows how deposit rates in more and less concentrated markets moved alongside the federal funds rate over the recent monetary cycle. As the federal funds rate rose from late 2021 to 2023, deposit rates moved sharply higher as well. Among banks in the bottom quartile of the concentration measure, the median effective deposit rate rose from about 0.33 percent in late 2021 to 2.81 percent by mid-2024. Among banks in the top concentration quartile, it rose from roughly 0.35 percent to 2.46 percent. Deposit funding costs therefore increased across both groups as monetary policy tightened, but the increase was substantially larger among banks operating in less concentrated deposit markets.
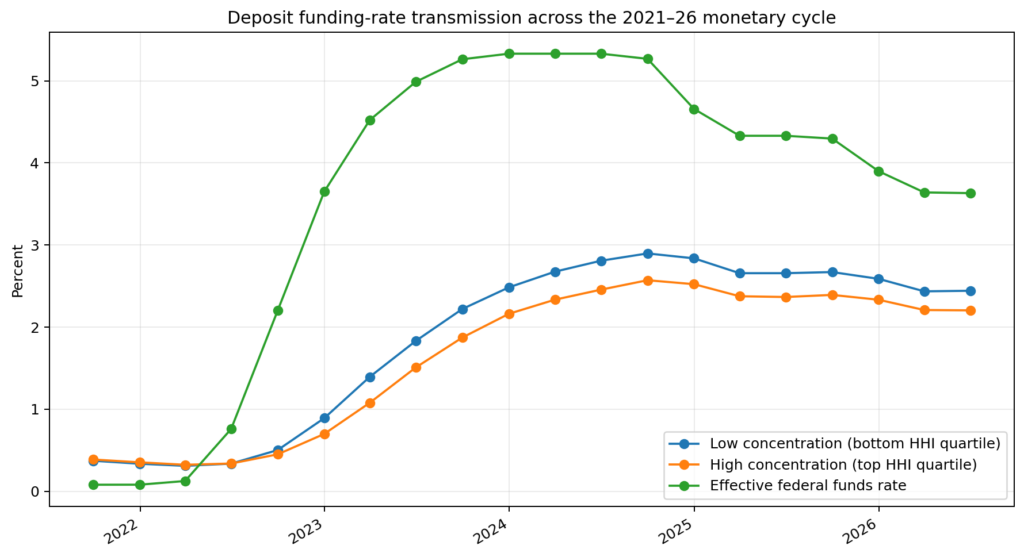
Note: The blue and orange lines show median effective deposit funding rates for banks in the bottom and top quartiles of the concentration measure. The green line shows the quarterly average effective federal funds rate.
Source: Calculations using FFIEC Call Reports, FDIC Summary of Deposits, and Federal Reserve Bank of New York data.
Figure 3 summarizes that difference using a deposit beta, the proportion of a movement in the policy rate that is reflected in deposit rates. Using a sample of 4,168 banks and fixing their competitive classification, I estimate a cumulative beta of roughly 46 percent for banks in more competitive markets, compared with about 40 percent for banks in more concentrated markets. Put simply, over this tightening-and-hold phase between late 2021 and mid-2024, a 100-basis-point increase in the effective federal funds rate was associated with an approximately 46-basis-point increase in effective deposit rates for the competitive group, compared with around 40 basis points for the concentrated group. In a second test with more controls and more granular use of time intervals, I found that banks in the more concentrated group increased their deposit rates seven basis points less than those in the more competitive group for every 100-basis-point movement in the effective federal funds rate.
What happened when rates began to fall is equally revealing. Taking mid-2024 as the pre-easing peak and following the same bank sample through mid-2026, the cumulative easing beta was approximately 19 percent in more competitive markets and 15 percent in more concentrated ones. Those betas are considerably lower than during tightening, but the two episodes are not directly comparable. Over this sample, the easing cycle was much shorter and smaller than the preceding 525-basis-point tightening, and effective funding costs adjust with a lag. Recent evidence on U.S. bank funding costs similarly finds that pass-through tends to increase with the length and magnitude of a policy cycle, with little persistent difference between tightening and easing. Deposit funding rates therefore adjusted more strongly in competitive markets in both directions. The recent U.S. cycle does not support a simple story in which banks in concentrated markets are slow to raise deposit rates but unusually quick to cut them. Instead, the evidence points to weaker deposit-rate repricing in concentrated markets whether policy rates are rising or falling. Market structure, in other words, appears to be associated with the overall sensitivity of deposit pricing to monetary policy.
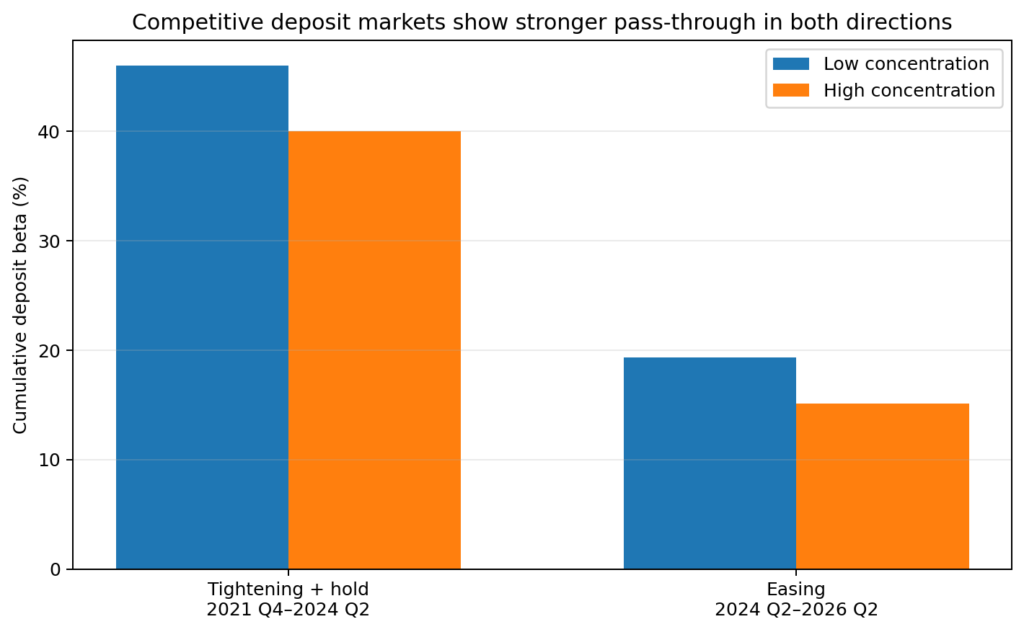
Note: Cumulative deposit betas are calculated for a common sample of 4,168 banks observed at the relevant endpoints of the cycle. Banks are classified using their concentration exposure in late 2021. Low concentration refers to the bottom HHI quartile and high concentration to the top HHI quartile.
Source: Calculations using FFIEC Call Reports, FDIC Summary of Deposits, and Federal Reserve Bank of New York data.
What the evidence can and can’t show
These findings fit into a broader literature showing that deposit competition is part of monetary transmission. Stephen Kho found that more concentrated banking sectors in the eurozone pass unexpected monetary tightening through to deposit rates more slowly but easing more quickly than less concentrated sectors. The recent U.S. evidence instead points to weaker repricing in concentrated markets in both directions.
Itamar Drechsler, Alexi Savov and Philipp Schnabl’s work in “Deposits Channel of Monetary Policy” shows that when the Federal Reserve raises rates, banks with greater market power widen the spread between the federal funds rate and what they pay depositors. The rate of deposit withdrawals is also larger in more concentrated markets. Their central insight is important for these results: a policy-rate increase does not mechanically become an equivalent increase in deposit rates. Banks raise their deposit rates less in order to capture additional profit, and the competitive environment facing banks helps shape how much of that policy-rate increase reaches depositors.
Digital banking adds another dimension. Research by Isil Erel, Jack Liebersohn, Constantine Yannelis and Samuel Earnest found that a 100-basis-point increase in the federal funds rate leads to a roughly 30-basis-point larger increase in deposit rates at online banks than at traditional banks. The authors argue that financial technology can strengthen monetary transmission by lowering search costs and expanding banking markets, making it easier for depositors to respond to differences in rates. This makes the relationship I find between local concentration and deposit-rate pass-through particularly interesting. County-level concentration is an imperfect measure of competition in a world where online banks can compete for deposits nationally. Yet, local banking structure still appears to contain information about how strongly banks reprice their deposits.
Competition is also unlikely to be the only mechanism at work. Banks differ in their demand for deposits and in their access to alternative sources of funding. Recent work by Amina Enkhbold shows that when policy rates rise, banks in concentrated markets can substitute toward funding from institutional sources rather than raising deposit rates to attract funds from retail customers, weakening the transmission of monetary policy through bank funding and ultimately to mortgage rates. The analysis cannot distinguish cleanly between market power, depositor search frictions and differences in banks’ funding strategies. What it does provide is a current, bank-level view of the recent U.S. monetary cycle, with banks in more competitive markets showing stronger repricing in both directions.
There are other important limits to what these patterns can tell us. The concentration measure is based on banks’ exposure to county-level deposit markets, but concentration is not the same thing as market power. Counties with different banking structures may also differ in customer demographics, deposit composition, local economic conditions and the types of banks operating there. And the effective deposit funding rate captures the average cost of a bank’s interest-bearing domestic deposits rather than the advertised rate on any particular savings account. The results should therefore be read as evidence that market structure is associated with differences in monetary transmission, not as proof that concentration alone causes those differences.
The takeaway for central banks
For central banks, the implication is not that competition policy should become another monetary-policy instrument. It is that market structure is part of the environment through which monetary policy operates. Central banks already assess transmission through bank funding conditions, credit markets, liquidity and financial-market prices. Deposit-market competition belongs in that picture as well. If banks facing different competitive conditions adjust their deposit funding costs differently to the same change in the policy stance, then monetary policy can reach the banking system unevenly even before those differences feed through to lending and the wider economy.
That question is becoming more important as the deposit market itself changes. Online banking, easier rate comparison and digital account opening can weaken geographic barriers, while differences in customer behavior and banks’ access to alternative funding can alter the pressure to compete for deposits. The relevant policy question is therefore broader than whether banking markets are concentrated according to any single measure. It is how competitive pressure affects the repricing of deposit-based funding as monetary conditions change. Paying closer attention to that relationship could give central banks a fuller picture of how quickly, and how evenly, their policy decisions are passing through the financial system.
Author’s Disclosures: The author reports no conflicts of interest. You can read our disclosure policy here.
Articles represent the opinions of their writers, not necessarily those of the University of Chicago, the Booth School of Business, or its faculty.
Subscribe here for ProMarket’s weekly newsletter, Special Interest, to stay up to date on ProMarket’s coverage of the political economy and other content from the Stigler Center.