



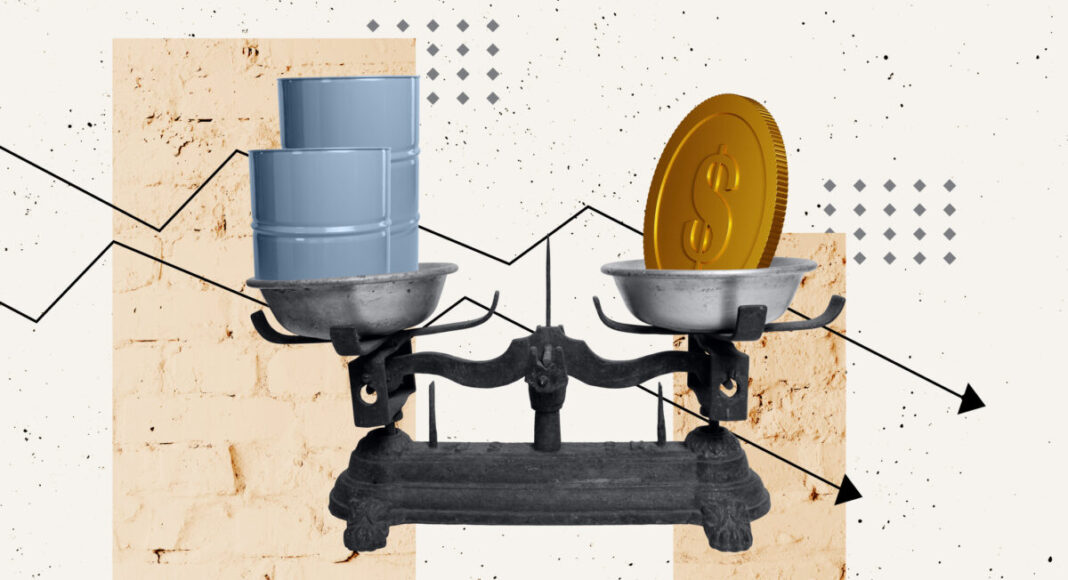

In new research, Michele Fioretti, Kavanaugh FitzPatrick, and Alessandro Iaria find that under United States sanctions, Venezuela’s oil output fell by two-thirds, but the gas flared per barrel more than doubled.
In August 2017, the United States imposed financial sanctions on Venezuela and, in January 2019, cut off the state oil company, PDVSA, from the dollar system. As a result, Venezuelan oil output fell by about two-thirds from its 2012–2016 average.
In theory, an unintended consequence of these sanctions would be to reduce greenhouse gas emissions, as pollution falls in step with output. However, while Venezuelan output fell by two-thirds, the gas burned off at its oil fields fell by only about a fifth. Applying environmental standards to oil extraction relies on specialized equipment. When sanctions reduced the trade of these inputs as well, the production process eroded, and the remaining oil production generated more emissions per barrel of output than before.
In a new paper, we studied just how much these sanctions exacerbated greenhouse gas emissions from the Venezuelan oil sector. We followed the oil fields in six Latin American countries—Venezuela, Argentina, Brazil, Colombia, Ecuador, and Mexico—from 2012 to 2024 to compare Venezuela’s oil output and emissions with those of the five unsanctioned countries.
To do so, we combined these countries’ production records with two satellite measurements of pollution. The first was the World Bank’s record of gas flaring, which measures the burning of natural gas byproducts that arise when extracting oil. Special equipment is available to capture the gas and even recycle it rather than flare it as carbon dioxide. The second measurement was atmospheric methane from the European Sentinel-5P satellite, which detects gas that is vented, meaning released unburned. Vented gas stays as methane, which does far more damage to the climate than carbon dioxide and is invisible to the satellites that count flares.
Output collapsed and flaring did not follow
As shown in Figure 1, Venezuelan output was already declining in 2012, fell much faster after the first sanctions hit in 2017, and by 2022–2024 was less than a third of its level before sanctions. The volume of gas flared fell too, but only to about four-fifths its pre-sanction level. The gas flared for each barrel therefore rose, from about 20 cubic meters in 2012–2016 to a peak near 80 in 2020 and an average of 48 in 2022–2024. How much of the fall in total oil output is due to the sanctions is debated. We focus on why pollution per barrel increased even as oil production fell.
Figure 1: Oil production and gas flared per barrel in Venezuela and five unsanctioned Latin American producers
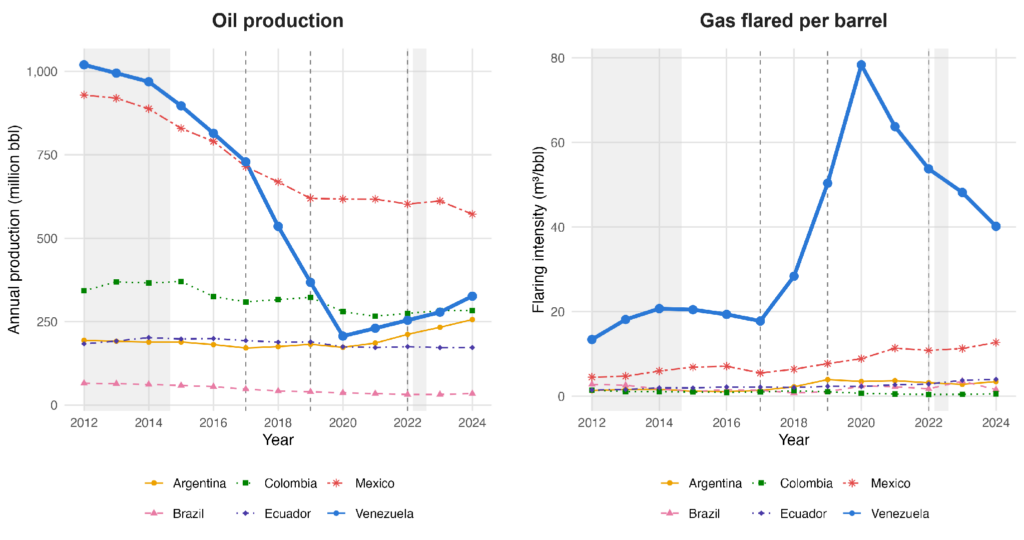
If only the scale of production had changed, flaring in 2022–2024 would have fallen in proportion to output. It is about 2.4 times what that benchmark implies. Flaring per barrel also rose in some of the unsanctioned countries. The largest increase, in Mexico, was under 10 cubic meters per barrel, against 28 in Venezuela.
Where the extra pollution comes from
Three things can raise pollution per barrel when an oil industry shrinks. The mix of fields, which vary in how feasible it is to capture natural gas, can change (composition). The system that moves the crude and handles its gas can stop coping, so that gas once captured now escapes (strain). Or the upkeep of the fields can be cut (maintenance). These factors are not independent and often influence each other. Sanctions impact all three, so we studied each one.
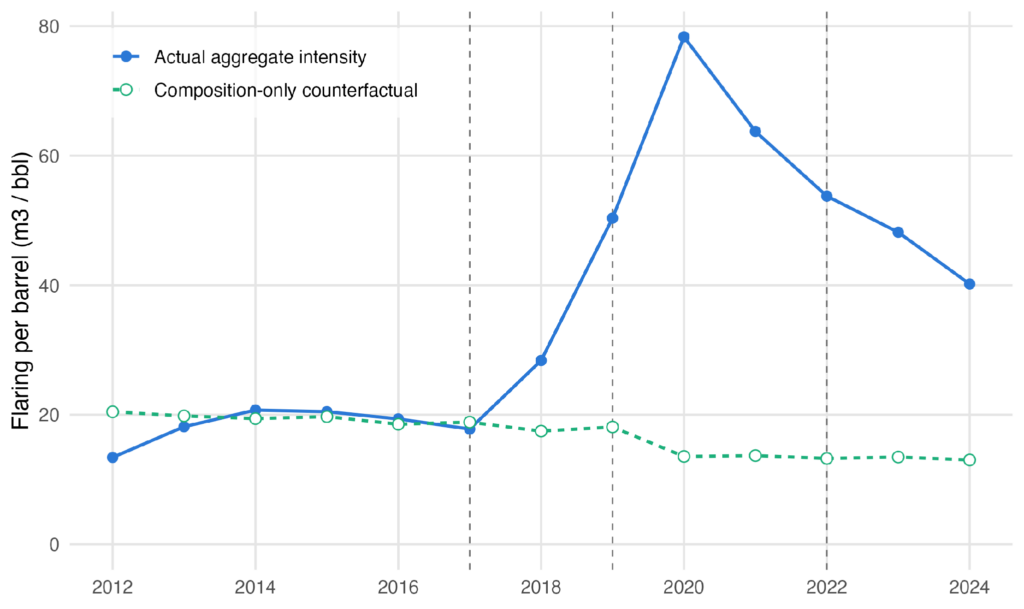
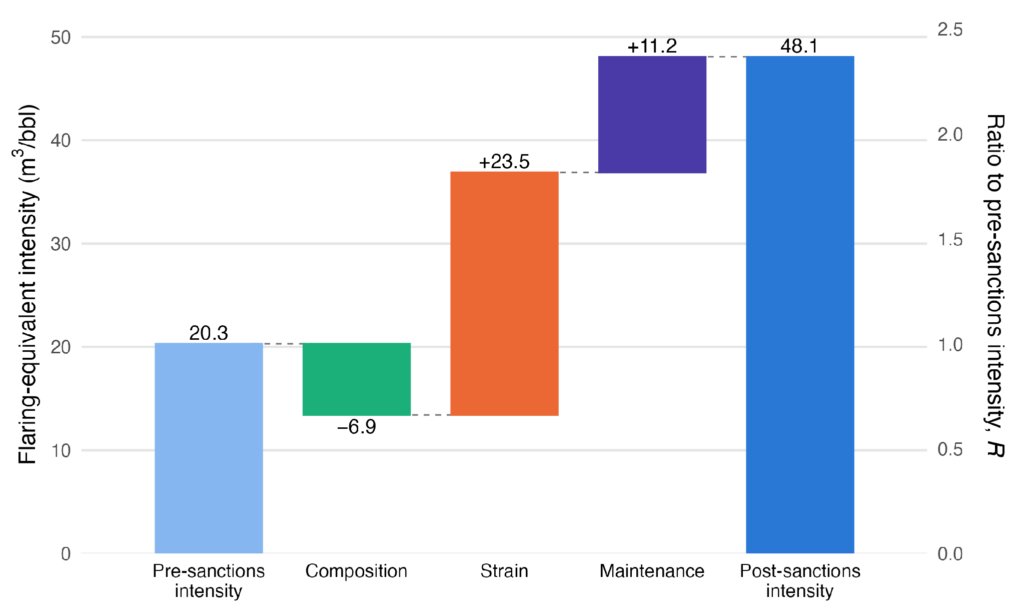
Composition: In Venezuela, the change in the mix of fields actually lowered pollution per barrel. Production shifted toward the Orinoco Belt, where foreign partners such as Chevron and the China National Petroleum Corporation kept their joint ventures running and where the extra-heavy crude contained almost no gas. If each field had kept its pre-sanctions flaring per barrel and only the fields’ shares of national output had changed, the national average would have fallen by 6.9 cubic meters. That is the dashed line in Figure 2. The whole increase, and more, comes from inside the fields that kept producing: 34.7 cubic meters per barrel.
Figure 2: Gas flared per barrel in Venezuela, actual and if only the mix of fields had changed
Strain: Most of that increase we ended up assigning to strain. Orinoco crude is as thick as tar and flows through a pipeline only when it is thinned with a diluent, naphtha, a light petroleum product that Venezuela bought from the U.S. until the January 2019 sanctions. Heavy-oil wells cannot be slowed without damaging them, so when diluent runs short the crude backs up, the system is overwhelmed, and the equipment along the pipeline route releases methane. After the 2019 sanctions, operators also stretched the remaining naphtha with light crude from conventional fields in the east, which hold far more gas and whose compressors for pumping it back underground stand idle: maintenance there had been eroding before the sanctions, which then cut off the imported parts needed to repair them.
We tested the strain mechanism by assessing how pollution measurements responded to a sudden price change from outside of Venezuela. We used the price of naphtha, which is set far from Venezuela’s oil fields and cannot respond to them. We asked how the methane above each ten-kilometer square of Venezuelan territory moves from month to month as the price of naphtha changes. The amount of methane produced rises with the naphtha price along the pipelines that carry diluted heavy crude. Along similar pipelines carrying crude that flows without diluent, and over the Orinoco wells themselves, whose crude holds almost no gas, we did not find additional methane emissions. Over the gas-rich eastern fields, the relationship between naphtha prices and emissions is positive but imprecise. Naphtha and crude oil prices move almost together, so the naphtha price could be standing in for the oil market as a whole, but it is hard to see why an oil-market effect would appear along the pipelines that carry diluted heavy crude and not along similar pipelines nearby that carry crude needing no diluent. When we redraw the pipeline corridor at random 999 times, no draw produces a response as large as the observed one.
Maintenance: To test the effect of maintenance, or the upkeep of fields, we used a change in U.S. policy for comparison. In November 2022, the U.S. Treasury issued a license that let Chevron, and only Chevron, resume operating its Venezuelan joint ventures, maintenance and repair included. Operating spending at Chevron’s fields rose by about 45% relative to other Venezuelan fields. At those fields, after the license, a 1% rise in spending per barrel is associated with roughly 0.5% less flaring. However, only three fields enter this estimate, so we regard it as suggestive. PDVSA’s upkeep was already eroding before 2017, and the sanctions deepened the decline by cutting off imported parts and foreign service firms.
Applied to the fall in operating spending under sanctions, that estimate attributes about a third of the increase inside surviving fields, or 11.2 cubic meters per barrel, to deferred maintenance. The remaining 23.5 is what we assign to strain, as shown in Figure 3. It is a remainder in the flaring data; the direct evidence for the mechanism is the methane result.
Figure 3: The rise in gas flared per barrel, split into composition, strain, and maintenance
The oil sector’s climate bill is about $11 billion a year
To value the emissions produced by the Venezuelan oil sector, we used the U.S. Environmental Protection Agency’s 2023 estimates of the damage done by a ton of carbon dioxide and by a ton of methane. On that basis, the gas Venezuela flares creates about $5 billion of climate damage a year. The methane its oil and gas sector emits, about 3.6 million metric tons in 2024 on International Energy Agency figures, costs about $6 billion. That is some $11 billion in all per year, or roughly $40 for every barrel the country still produces. These figures are the sector’s whole yearly bill, not the part due to the sanctions.
To estimate the impact of sanctions, we compared this total figure with the proportional decline in output. There is about a $3 billion per year difference between today’s yearly flaring damage (2022–2024) and what would have been expected if flaring damages decreased in proportion to output. For venting we can only give a lower bound, because the methane satellite’s record begins in late 2018, after the first sanctions. If Venezuela vented no more methane before the sanctions, when it produced three times as much oil, asthan it does today, there would have been at least $4 billion less in venting damage. The two together come to roughly $7 billion a year in excess of what would be expected if emissions decreased in proportional decline to output. We attribute this part of the $11 billion of damages the oil sector produces each year in Venezuela from extracting oil to the sanctions. For scale, one estimate puts the oil revenue that sanctions cost Venezuela at about $16 billion a year.
Policy implications
Sanctions against Venezuelan oil have bundled two restrictions that need not go together. One denies oil revenue to the government, which is the political aim. The other denies the oil fields the diluent, spare parts, and service contractors that limit pollution per barrel, and the extra pollution is a side effect. The published terms of the Chevron license tried to separate the two: they authorized operation, maintenance, and repair while barring payments of taxes and royalties to the government. In practice, the separation was incomplete. Bloomberg reported in 2025 that an undisclosed supplement had allowed Chevron to make certain payments to the Venezuelan government. And the license covered production as well as upkeep: output at Chevron’s fields recovered strongly, and their flaring rose in absolute terms.
The lesson we draw is to license the upkeep separately from the barrels. We propose an environmental carve-out: a license that protects compressor parts, leak repair, gas capture and reinjection equipment, and the diluent that upkeep requires, while still allowing restrictions on drilling and lifting services. Sanctions regimes already exempt food and medicine in the same way. The list has to be narrow, because parts and contractors can be diverted to raising output.
Such a license should be conditional on results. An operator’s return on maintenance is the oil it keeps flowing, while the avoided climate damage goes to everyone else, so upkeep is under-provided even without sanctions. Flaring at each licensed field can be checked by satellite, without the cooperation of the sanctioned state, and renewal can depend on it. Flaring alone is not a sufficient test, because a rule that counts only flares can be met by venting the gas instead, which heat-sensing satellites do not see and which does more damage. The methane satellite we used resolves only areas of about ten kilometers, too coarse to assign emissions to a single field, so operators would also have to meter and report the gas they capture.
Venezuela has since moved beyond that choice. After the change of government in Caracas in January 2026, the U.S. Treasury Department reopened the Venezuelan oil sector through a series of general licenses, which apply to anyone who meets their terms, and in August, the White House announced long-term concessions on 17 oil fields for a company part-owned by the U.S. government. The licenses again permit the diluent and the repairs, and they permit production to grow, the combination that raised flaring at Chevron’s fields. None of the six oil-sector general licenses in force at the end of September mentions methane, flaring, venting, or emissions. Five of them require a report to the Departments of State and Energy every 90 days. Four of those reports concern sales and supplies. The fifth covers the field operations of six named oil companies and must list quantities, values, and payments to the Venezuelan government. The volume of gas captured could be added to it.
A license cannot solve the longer-run problem alone. Rebuilding Venezuela’s gas-handling system would take tens of billions of dollars of investment that cannot be recovered once it is made. Furthermore, as two of us argued in an earlier ProMarket article, firms hold back such investment when they cannot rely on the rules staying in place. Both governments have changed them: Caracas forced the Orinoco projects into state-controlled ventures in 2007, and Washington revoked the 2022 Chevron license in early 2025.
Venezuela may not be the only case. For Iran, aggregate World Bank and U.S. Energy Information Administration data imply that flaring per barrel was roughly a third higher after the 2018 sanctions than before, though they are too sparse for a field-level analysis and we have not tested the mechanisms there. Sanctions on an oil producer change how the remaining oil is produced as well as how much of it there is, and an assessment that counts only barrels and revenue leaves that cost out.
Authors’ Disclosure: The research described in this article was funded by the British Academy/Leverhulme Small Research Grants Scheme (SRG2324/240698) and the European Research Council (ERC Starting Grant 101221025, BALANCE). The authors did not receive financial support from any firm or person for this article or from any firm or person with a financial or political interest in this article. You can read our disclosure policy here.
Articles represent the opinions of their writers, not necessarily those of the University of Chicago, the Booth School of Business, or its faculty.
Subscribe here for ProMarket’s weekly newsletter, Special Interest, to stay up to date on ProMarket’s coverage of the political economy and other content from the Stigler Center.