

Trade wars between the United States and Canada have sharply reduced the number of Canadian tourists traveling to the U.S. In new research, André Kurmann, Étienne Lalé, and Julien Martin use novel methods to measure how this decline in tourism has negatively impacted American workers and communities.
Much of the current debate about geopolitical tensions between the United States and Canada focuses on how tariffs raise import prices, disrupt cross-border supply chains, and squeeze margins for firms and consumers. But this debate misses an additional channel that is easy to overlook and potentially just as consequential: how tensions are deterring Canadians from travelling to the U.S. Amid President Donald Trump’s rhetoric about acquiring its northern neighbor and escalating tariffs, Canadian visits to the U.S. fell by about 25% in 2025 relative to 2023–24 levels.
In a new paper, we measure the consequences of this decline in tourism for U.S. local labor markets using detailed data on individual business visits and real-time employment records. We estimate that the drop in Canadian visitors cost between 14,000 and 42,000 American jobs at small establishments in retail and leisure and hospitality, concentrated in fewer than 3% of U.S. ZIP codes. In other words, when Canadians stop traveling to the U.S., restaurants and small retail shops in tourist-dependent communities take a hit.
Our findings add to a growing body of evidence that international conflicts can carry significant costs for domestic economies through their effects on foreign visitor flows. Our study has the distinguishing feature that we can measure those costs at a highly granular level and in near real time compared with current governmental data, which are often too broad and released with delays.
A 25% decline—and why measuring its impact is hard
Canada is the U.S.’ largest source of international visitors, accounting for close to a third of all international arrivals and roughly 10% of visitor spending. In 2025, that flow fell sharply. Border-crossing data in Figure 1 show that Canadian residents returning from U.S. trips (by air or land travel) ran about 25% below the 2023–2024 average throughout the year. Non-Canadian international visitors, by contrast, were essentially flat, confirming that this has so far been a Canada-specific shock.
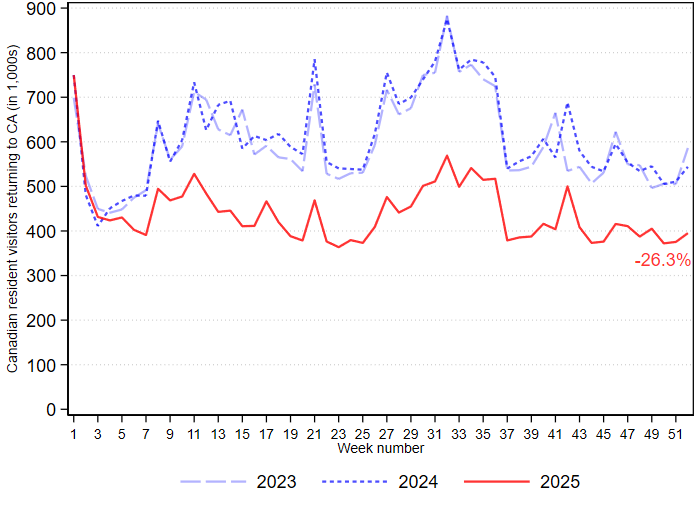
Figure 1. Canadian resident visitors returning to Canada from the United States, by week, 2023–2025 (thousands). Source: Statistics Canada, Frontier Counts.
Measuring the employment consequences of this shock poses significant challenges. Tourist spending is highly localized and concentrated in specific service sectors. Official labor market statistics are published with lags of several quarters to several years and are rarely available at the geographic and sectoral granularity needed to accurately capture the consequences of the shock. To get around these limitations, we combine two novel private-sector datasets.
The first is smartphone foot-traffic data from Advan Research, covering more than eight million points of interest across the U.S. A distinctive feature of measuring Canadian visitors to the U.S.is that the two countries share a highly integrated mobile device ecosystem, which allows Advan to identify devices with home locations in Canada and track their visits to U.S. businesses. This lets us construct a precise measure of Canadian visitor exposure for each ZIP code and 6-digit industry classification using 2024 data, before the decline began.
The second dataset is real-time employment records from Homebase, a scheduling and payroll platform used by over 150,000 small establishments (typically fewer than 50 employees) across the U.S., primarily in food services, retail, and leisure. Homebase records hours worked and wages at the daily level, with minimal reporting lag.
Where Canadians go in the U.S. and what happens when they stop going
Figure 2 illustrates the geographic distribution of our exposure measure—the share of foot traffic attributable to Canadian visitors in 2024—across U.S. ZIP codes and service-sector industries. Canadian visitor shares are highest in border regions from Washington state to Maine, as well as major tourist hubs in Nevada, Florida, and California. In communities within driving distance of major Canadian population centers, Canadian visitors can account for more than 5%—and in some cases over 10%—of total foot traffic at retail and leisure establishments. This concentration is the key to our identification strategy.
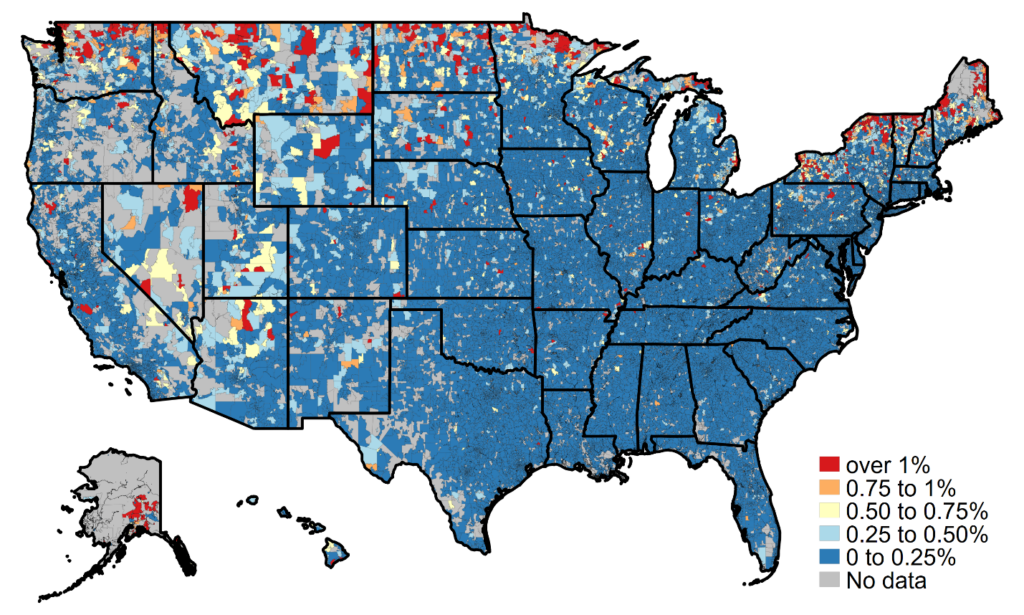
Figure 2. Share of Canadian visitors relative to combined Canadian and U.S. visitors across ZIP codes in 2024, for retail trade and leisure and hospitality. Source: Authors’ calculations using Advan data.
We compare employment, hours worked, and wages at establishments in the most-exposed markets—those where Canadians account for roughly 1% or more of total visitor traffic—to outcomes at less-exposed establishments, before and after the tourism decline began in January 2025. A rich set of fixed effects controls for local economic conditions, industry-wide trends, and time-invariant establishment characteristics, so that the estimated difference can be attributed to differential Canadian visitor exposure.
The results are stark. As shown in Figure 3, employment at highly exposed and less exposed establishments moved in near-perfect lockstep throughout 2024. Starting in March–April 2025, a gap opens up: employment in the most exposed markets starts falling relative to less exposed markets. This gap deepens through the summer and then persists through the end of the year. By mid-2025, establishments in the most-exposed markets employed roughly 6% fewer workers relative to comparable establishments in less-exposed markets.
Hourly wages and hours per worker, in contrast, show no significant response. This means the adjustment happened primarily through reductions in headcount, which is consistent with evidence from other demand shocks affecting small service-sector establishments.
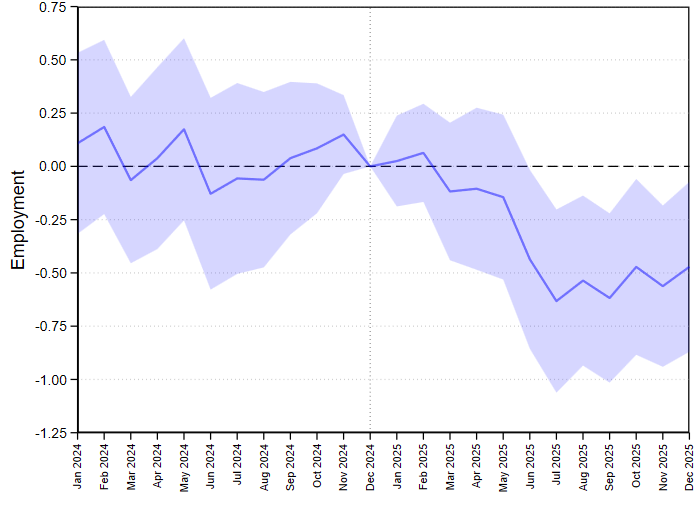
Figure 3. Effects of Canadian tourism decline on U.S. local business employment. 90% confidence intervals are in blue. Source: Authors’ calculations using Advan and Homebase data.
Aggregate losses are modest nationally, but severe locally
Aggregating these establishment-level estimates to national totals requires making assumptions about the broader population of affected businesses. We use conservative assumptions, focusing on the small establishments covered by Homebase and abstracting from potential demand spillovers onto non-exposed neighboring businesses, meaning indirect employment losses from reductions in demand in other parts of the economy. Our estimates imply that the decline in Canadian visitors accounts for between 14,000 and 42,000 fewer workers employed in exposed markets, depending on the exposure threshold and the estimation window used.
Relative to the 17 million workers employed at small retail and leisure establishments nationwide, these numbers are modest, although they contribute meaningfully to the overall weak job growth for 2025 in retail (–57,000) and leisure and hospitality (+150,000). Perhaps more importantly, the employment losses are geographically highly concentrated. For instance, for the most-exposed 1,500 ZIP codes—home to 9 million residents—we estimate an impact of 20,300 fewer jobs from June 2025 onward, which represents a roughly 6% contraction in local retail and leisure employment and a 0.5% decline in total private-sector employment in those communities. These are sizable local shocks, especially given that the effects persist rather than dissipate.
Moreover, two factors suggest that the true losses are larger. First, our Homebase sample skews heavily towards small establishments: large hotels, entertainment venues, and convention centers that are likely also affected therefore fall outside our coverage. Second, a growing literature finds that tourism generates significant demand spillovers into non-tourism sectors. These indirect employment losses are harder to estimate and likely amplify total losses.
The political geography of the shock is also worth noting. ZIP codes most exposed to Canadian tourism are disproportionately Democratic-leaning and tend to have lower household incomes. This contrasts with patterns documented for tariff retaliation in the US–China trade war, which fell primarily on Republican-leaning counties.
Conclusion and implications
Our analysis makes a simple point that most trade policy debates tend to overlook. Beyond goods trade and supply-chain disruptions, geopolitical tensions can deter foreign visitors and hit the economy fast. Such shocks strike specific places and non-tradable sectors that may find it difficult to absorb the blow. Whereas major tourist destinations like Las Vegas or Miami may be able to offset the shock by attracting more domestic visitors, less prominent places such as communities along the U.S.-Canada border may have less capacity to do so.
More broadly, our results demonstrate that combining smartphone-based visitor-origin data with high-frequency payroll records can deliver rapid, granular assessments of tourism disruptions as they unfold—well before traditional government statistics become available. For policymakers and researchers trying to assess the real-time consequences of geopolitical disruptions, public health crises, or macroeconomic shocks on tourism-dependent communities, our methodology offers a practical template.
Author Disclosure: The author reports no conflicts of interest. You can read our disclosure policy here.
Articles represent the opinions of their writers, not necessarily those of the University of Chicago, the Booth School of Business, or its faculty.
Subscribe here for ProMarket’s weekly newsletter, Special Interest, to stay up to date on ProMarket’s coverage of the political economy and other content from the Stigler Center.