

A new empirical paper estimates the scope and impact of common ownership in fintech markets. The authors find limited common ownership among private fintech start-ups, but this picture changes sharply with fintech firms going public.
Common ownership, which refers to the overlapping of minority but potentially influential investors in competing firms, has stirred antitrust waters with ripple effects. Ground-breaking empirical studies have revealed that its presence is widespread in several industries such as airlines and banks, and its economic costs are significant such as deadweight loss, surplus redistribution from consumers to corporations, and reduction in total welfare. Common ownership also raises concerns not only in oligopolistic product markets but also in labor markets, in the form of increased market and monopsony power.
But, interestingly, the common ownership story has a silver lining: it may lead to positive effects on competition, innovation, and welfare. This fact in itself as well as the theoretical complexity of the issues at hand make it a fascinating area of empirical study.
Most empirical evidence to date focuses on US markets and publicly listed firms, in which a small group of large institutional investors such as mutual and index funds have extensive common shareholdings. Passive investing and portfolio diversification are the main culprits for the dramatic rise in common ownership with profound potential implications for competition and consumers. But are the levels and effects of common ownership uniform, or distinct, in different markets and countries? Are results similar for all types of commonly owned firms and overlapping investors?
In our paper, we take fintech markets as a case study to provide novel insights on these questions. Fintech firms use technology such as digital software or mobile applications to improve and automate traditional forms of finance for businesses and consumers. PayPal, Stripe, Nubank, Revolut, Plaid are some examples. Fintech is a fast growing sector with an increasingly important role in the provision of financial services, potentially disrupting stagnant competition among incumbent banks and finance providers. At the same time, fintech markets differ in significant ways from traditional, more widely researched product markets. Fintech markets are typically more dynamic in nature with innovation playing a central role.
Fintech firms are usually privately held companies and start-ups. Their largest owners are venture capital (VC) investors and private equity (PE) investors, as opposed to large asset management firms such as BlackRock, Vanguard and State Street, the so called ‘Big Three’, which are often the largest owners in publicly listed companies.
The financial strategies and governance models of common VC investors and entrepreneurial start-ups are notably different from those of large asset managers and widely held public corporations. For instance, control in private firms is less standardized, not always a function of voting power or the ‘one-share-one-vote’ rule but may be tailored by contract. At the same time, VC investors are typically ‘active’ investors, unlike ‘passive’ large asset managers, they often contract for special control rights and may facilitate information flows among their portfolio firms. As such, the specific market, ownership, and governance characteristics of common ownership in fintech may present interesting particularities to study and draw inferences from.
Thus far, fintech markets and other sectors with similar innovative focus and attributes have been underexplored from the lens of their ownership structure and its effect on competition. In addition to filling this research gap, our paper provides an additional, global, layer: we show the extent and impact of common ownership in fintech markets, in comparative terms, in a large number of national markets of different size and economic and investment outlook.
Indeed, as Figure 1 shows, 64% of total investments in fintech globally is undertaken by VC and PE firms. Other types of investors such as investment banks, corporate VC, and asset management funds also invest in fintech companies, but their investments’ share is much smaller. The prevalence of VC and PE investors is also evident from Table 1 presenting 10 largest fintech investors worldwide. Interestingly, however, the type and identity of the top 10 fintech investors vary from country to country, as documented in more detail in our paper.
Figure 1. Fintech Investment Structure by Investor Category (Worldwide)
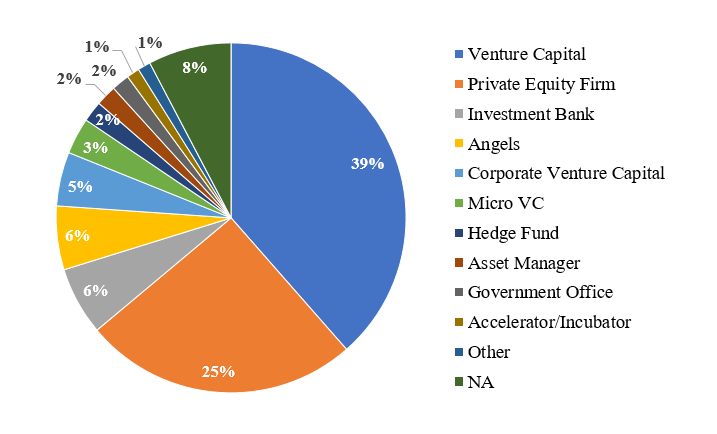
Table 1. Top 10 Fintech Investors Worldwide
| Investor name | Investor type | Number of fintech companies with minority ownership | Investor’s share of total worldwide $ investment |
| Softbank | Venture Capital | 70 | 2.39% |
| Sequoia | Venture Capital | 115 | 2.07% |
| Tiger Global Management | Private Equity Firm | 102 | 1.48% |
| Temasek Holdings | Private Equity Firm | 26 | 1.10% |
| GIC | Private Equity Firm | 25 | 1.04% |
| JP Morgan | Investment Bank | 49 | 0.99% |
| The Carlyle Group | Private Equity Firm | 10 | 0.99% |
| General Atlantic | Private Equity Firm | 24 | 0.96% |
| Ribbit Capital | Venture Capital | 61 | 0.93% |
| Warburg Pincus | Private Equity Firm | 14 | 0.82% |
| Total | 382 | 12.77% |
We document low levels of common ownership among privately held fintech firms. We show that more vibrant and larger fintech markets are characterized by lower levels of common ownership, while smaller national markets and product market segments show considerably higher ownership overlaps in comparison. Among the analysed markets, the U.S. and the UK represent countries with the lowest observed common ownership, while Denmark and Ireland are examples of countries with the highest common ownership levels.
Similarly, the estimated effects of common ownership in private fintech firms are higher in the smaller markets. We use the so called ‘lambdas’ to measure these effects that capture the increased unilateral pricing incentives produced by common shareholdings in rival firms. Formally, the lambdas (also known as ‘profit weights’) estimate the degree of internalisation of rivals’ profits relative to own firm profits by the firm manager in its objective function due to common ownership. For robustness, we employ alternative control scenarios for the lambda calculations: a baseline scenario (where start-up founders retain control) and an alternative scenario (where external investors may have proportionate control) that reflect ‘lower-limit’ and ‘upper-limit’ estimates respectively. We also discuss other scenarios in-between, but the different alternatives do not materially affect our results.
As shown in Table 2 below (for selected countries), the estimated lambdas in any analyzed country are generally small, meaning competition is unlikely to be adversely affected. While the observed common ownership overlaps may produce some adverse effects, the effects are rather limited and not likely to raise significant competition concerns. This conclusion holds even for ‘upper-limit’ lambda estimations, in which case country lambdas are slightly higher than ‘lower-limit’ estimates but overall low. By comparison, the estimated lambdas under either of these scenarios are significantly smaller than those found in public markets, where the systematic presence of index funds, extensive investor overlaps and control dynamics in large public firms may make common ownership a real concern.
Table 2. Lambdas by Country
| Lower-limit estimates | Upper-limit estimates | |||||
| Country | N companies | Simple average | Weighted by revenue | Simple average | Weighted by revenue | |
| Europe | ||||||
| United Kingdom | 765 | 0.0007 | 0.0008 | 0.0089 | 0.0055 | |
| Germany | 194 | 0.0014 | 0.0025 | 0.0103 | 0.0067 | |
| France | 136 | 0.0015 | 0.0022 | 0.0114 | 0.0087 | |
| Spain | 112 | 0.0010 | 0.0012 | 0.0164 | 0.0219 | |
| Switzerland | 90 | 0.0003 | 0.0002 | 0.0050 | 0.0042 | |
| Sweden | 63 | 0.0032 | 0.0039 | 0.0199 | 0.0113 | |
| Italy | 53 | 0.0014 | 0.0012 | 0.0198 | 0.0149 | |
| The Netherlands | 52 | 0.0022 | 0.0009 | 0.0155 | 0.0039 | |
| Ireland | 46 | 0.0125 | 0.0172 | 0.1477 | 0.0815 | |
| Estonia | 40 | 0.0008 | 0.0004 | 0.0473 | 0.0103 | |
| Denmark | 31 | 0.0089 | 0.0234 | 0.0819 | 0.0842 | |
| Americas | ||||||
| United States | 2,375 | 0.0005 | 0.0015 | 0.0054 | 0.0045 | |
| Canada | 215 | 0.0005 | 0.0010 | 0.0102 | 0.0096 | |
| Brazil | 191 | 0.0016 | 0.0035 | 0.0179 | 0.0216 | |
| Mexico | 108 | 0.0025 | 0.0048 | 0.0305 | 0.0231 | |
| Colombia | 48 | 0.0009 | 0.0002 | 0.0123 | 0.0007 | |
| Chile | 38 | 0.0040 | 0.0021 | 0.0504 | 0.0162 | |
| Argentina | 37 | 0.0018 | 0.0014 | 0.0206 | 0.0108 |
Most interestingly, although we find limited common ownership among private fintech start-ups, the picture changes sharply with fintech firms successfully going public. On the one hand, our data and examples imply that the common ownership patterns observed in public fintech firms resemble those found in other public markets (airlines, banks) in that the largest fintech firms – once they succeed and go public – are incorporated into common ownership networks, such as of index fund portfolios.
In turn, the ownership structure of newly publicly listed versus mature public companies experiences a transition from founder(s) dominant ownership and control (immediately upon listing) to large asset managers being among the top investors (several years after the successful IPO). This is because as they grow, mature public fintech companies are more likely to be included in market indices, and therefore asset managers’ index funds.
Table 3 presents a list of the largest common owners in publicly listed fintech companies and provides an illustration of the significant presence of the largest asset management firms among the top common owners, just as in other analysed publicly listed companies.
Table 3: Largest Common Owners in Public Fintech Companies
| Shareholder Name | Number of Fintech Companies with Minority Ownership | Average Ownership Share |
| Vanguard | 54 | 5.36 |
| Temasek Holdings (Private) Limited | 10 | 4.33 |
| Blackrock | 63 | 3.94 |
| Capital Research and Management Company | 16 | 3.52 |
| Massachusetts Financial Services Company | 14 | 2.23 |
| T. Rowe Price Group, Inc. | 40 | 1.97 |
| Wellington Management Group LLP | 27 | 1.76 |
| Fred Alger Management, LLC | 12 | 1.50 |
| State Street Global Advisors, Inc. | 55 | 1.37 |
| Dimensional Fund Advisors LP | 32 | 0.96 |
All in all, the observed ownership and governance structures among private fintech start-ups suggest that common ownership is likely to raise little cause for concern. The largest fintech investors globally, and by country, have limited overlaps in such firms and common shareholdings are not as prevalent as in public markets. Moreover, common VC investors in start-ups have a beneficial role in innovation, knowledge diffusion and overall welfare.
Yet, when fintech firms go public and become more mature, their ownership composition transforms and often becomes dominated by large asset management funds. In certain situations, the overlapping minority institutional investors may have de facto joint control (e.g. in the absence of dominant start-up founders or other blockholders). It follows that the extent of common ownership in public fintech firms and its likely impact on competition may become potentially significant.
In this light, our advice to antitrust policymakers and enforcers is to conduct a case-by-case analysis of common ownership and its competitive effects. Two corollaries follow. Competition law enforcement should account for the differences in the type of firms, investors, and markets where common shareholdings are present. It would also be wise to consider and carefully balance the distinct implications of common shareholding for both competition and innovation especially in dynamic industries such as fintech.
In addition, the quality of available data, for instance on financing, ownership, governance, and M&A deal structures, is key to a well-informed assessment of common ownership cases by antitrust agencies. Such a case-by-case, empirically informed approach may naturally add complexity to competition analysis, but without it, competition policy risks being obsolete and seriously misguided. This is important because it may not only apply to common ownership cases, but may more broadly affect merger control policy and enforcement.
Articles represent the opinions of their writers, not necessarily those of the University of Chicago, the Booth School of Business, or its faculty.