
")
A new empirical study attempts to estimate the economy-wide welfare costs of common ownership. The authors find that they are large and have risen dramatically over the last quarter-century, particularly over the last decade.
A large chunk of the stock market is now owned by a few giant asset management firms. BlackRock just passed $10 trillion in assets under management. Vanguard has more than $7.2 trillion in assets under management. Fidelity has more than $4.2 trillion under management.
This trend has become widely known among economists as the rise of common ownership (or horizontal shareholding)—an arrangement that sees large investors owning shares in several competing firms. It has the potential to dampen companies’ incentives to compete aggressively to such an extent that some antitrust law scholars argue that common ownership constitutes “the greatest anticompetitive threat of our time.” Indeed, the Department of Justice, the Federal Trade Commission, the European Commission, and the OECD have all acknowledged concerns about the anticompetitive effects of common ownership. Earlier this year, the Department of Justice and the Federal Trade Commission launched a public inquiry seeking comments on new evidence of M&A’s effects on competition to inform potential revisions to the merger guidelines, including how to deal with common ownership.
The so-called “Common Ownership Hypothesis” challenges the conventional wisdom that profits and shareholder value are one and the same. The intuition for this hypothesis is straightforward. Imagine two firms, A and B, that compete against each other. If some investor owns a significant share in both A and B, and both companies’ managers make decisions with the intent of maximizing the income earned by the company’s shareholders (as opposed to maximizing any single company’s profits), then the management of firm A will take into account how aggressive pricing decisions will negatively affect the profits of firm B, which is partly owned by the common owner. Company B will do just the same with respect to company A. The presence of a common owner thus results in A and B competing less aggressively: both companies end up charging higher prices, earning larger profits, and consumers are worse off. Crucially, all of this occurs without any collusion between A and B. Although antitrust authorities have the power to investigate and prosecute companies that collude or abuse their market power to harm consumers, anticompetitive conduct facilitated by common ownership represents a “gray area” that does not fall under the umbrella of typical antitrust enforcement.
While there is growing empirical evidence of the anticompetitive effects of common ownership on prices, quantities, markups, managerial incentives, and profitability in particular industries, little is known about the economy-wide welfare cost of common ownership and its distributional impact—and for good reason. Measuring the welfare cost of common ownership is complex. It requires both new economic modeling and large amounts of granular data. It requires knowledge of both the competitive landscape (which pairs of firms are in competition with each other) and asset markets (which firm’s shares each investor holds).
In a new study, we ask: What happens if firms maximize shareholder value (as opposed to profits)? What is the resulting impact of common ownership on corporate profits, consumer surplus, and total welfare across many different industries? In short, we find that the economic impact of common ownership is large and has risen dramatically over the last quarter-century and particularly so during the last decade.
In our paper, we develop a new macroeconomic model that includes all public corporations in the United States and uses annual data since 1994. In our model, we can think of these firms as being connected through two large networks: a network of product similarity and a network of common ownership.
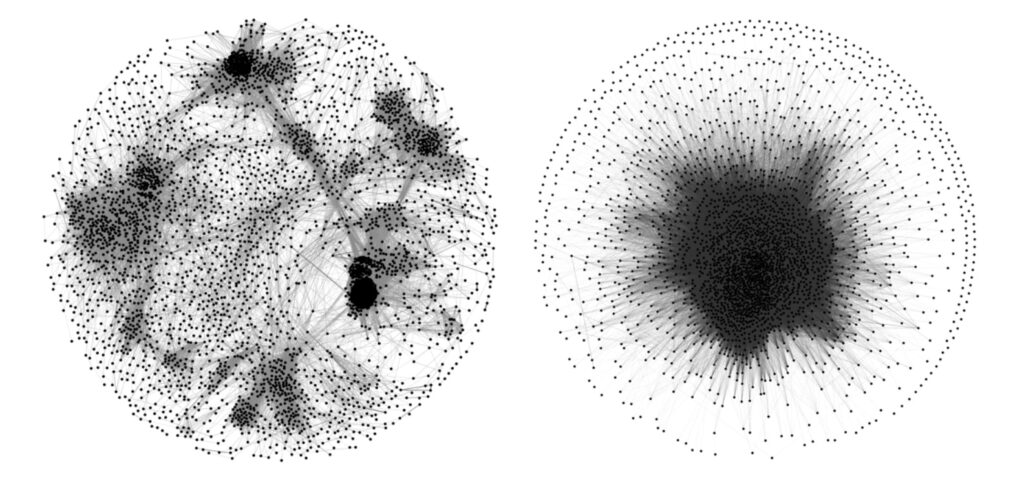
The network of product similarity, depicted on the left-hand side of Figure 1, captures the extent to which firms compete with each other in the product market. Each dot in the graph is a publicly-traded firm in the United States, and the networks links represent closeness in the product space. Firms that offer more similar products are closer in the product space and therefore compete more intensely with each other; more “isolated” firms face less intense competition, and thus end up charging higher markups. The data underlying this graph are developed by Hoberg and Phillips (2016). Using a methodology developed by Pellegrino (2019), our model uses these data as a “map” of the product market.
The network of common ownership reflects which investors own which firms and how much overlap in ownership exists between competing firms. It is plotted on the right-hand side of Figure 1. Firms with a large proportion of shares held by the same investors have weaker incentives to compete because doing so would hurt the portfolio profits of their largest and most influential owners. The source data on institutional shareholdings that we use to construct this network come from forms 13(f), which are filed with the SEC by large institutional investors.
The extent to which common ownership diminishes firms’ incentives to compete depends on how much these two networks overlap—in other words, common ownership has the strongest effects on firm pairs that are held by similar few investors and produce similar products. By combining data from firm financials, text-based product similarity, and institutional investor holdings of US publicly-listed corporations from 1994 to 2018, we are able to measure how much the overlap in ownership across firms reduces competitive behavior, as well as the economic toll that this reduction in competitiveness has on consumers.
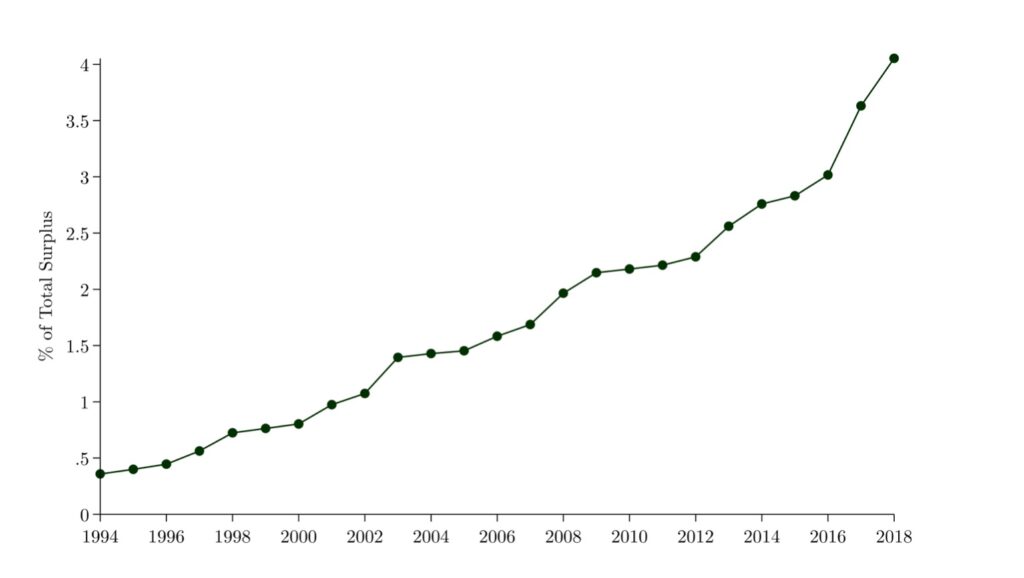
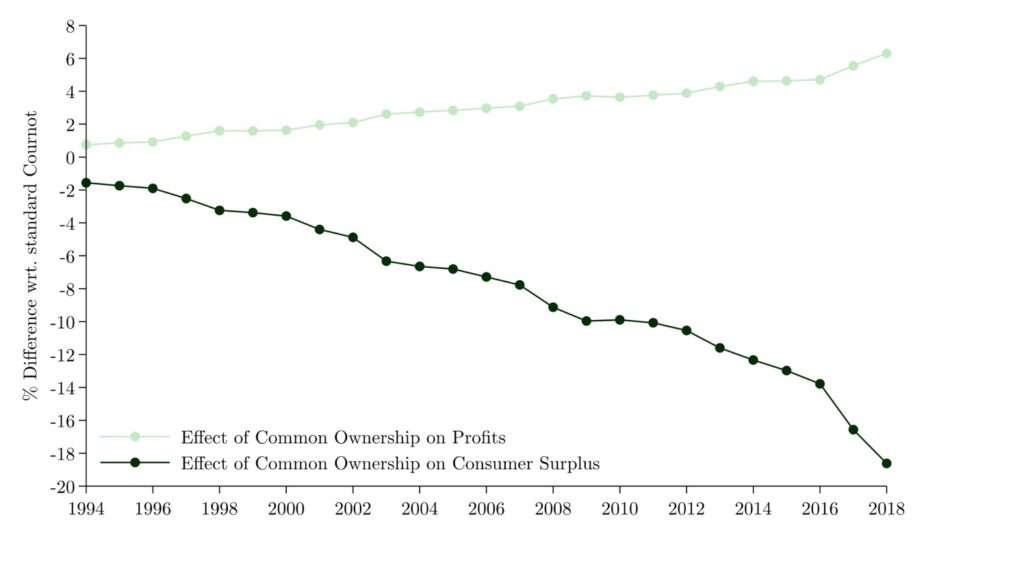
Our analysis reveals three broad patterns. First, the welfare costs of common ownership are significant (Figure 2). We estimate that in 2018, the most recent year of our sample, the deadweight loss due to common ownership amounted to $400 billion, which is equal to about 4 percent of the surplus generated by US public firms. This is a dollar measure of the economic value that is lost as a consequence of horizontal shareholding. Second, common ownership has large distributional consequences—it redistributes surplus from consumers to corporations. In 2018 alone, common ownership raised aggregate corporate profits by $378 billion (6.6 percent) but lowered consumer surplus by $799 billion (nearly 20 percent). Third, the negative effects of common ownership on total welfare and consumer surplus have grown considerably over the last two decades. Whereas common ownership reduced the total surplus in the economy by a mere 0.3 percent in 1994, this deadweight loss increased more than tenfold to 4 percent over the next quarter-century.
All these results are based on the (standard) assumption that firm managers weigh the profits of their respective shareholders in proportion to the size of their ownership stakes.
A common criticism of this assumption is that it does not reflect realistic models of corporate governance and decision-making. For example, agency problems between owners and managers may attenuate or even exacerbate the anticompetitive effects of common ownership. For this reason, in our study we also investigate how alternative assumptions about corporate governance modify these results. Rather than investors directly influencing firm decisions exactly in proportion to their ownership shares, larger investors may exert influence that exceeds the size of their stake. Under such an alternative super-proportional influence assumption, common ownership has nearly identical effects on deadweight loss, corporate profits, and consumer surplus. The anticompetitive effects that we estimate remain large even if we relax the assumption that investors can effectively monitor all of the companies in their portfolios, or that only block-holders (i.e., shareholders holding 5 percent or more of a company’s stock) can influence management: common ownership still leads to a deadweight loss of 2.5 percent of total surplus, raises firm profits by almost 5 percent, and lowers consumer surplus by almost 13 percent of total surplus in 2018.
In sum, our analysis suggests that the rise of common ownership has the potential to generate significant distortions and the reallocation of surplus in the US economy. However, academic research has only begun to scratch the surface when it comes to the welfare effects of common ownership. Various other consequences of common ownership on firm decision-making, including labor market power, innovation, firm productivity and cost efficiency, and dynamic collusion incentives are still waiting to be investigated. In light of the meteoric rise of common ownership and its relevance for antitrust policy and financial regulation, our paper presents several reasons for lawmakers and regulators to pay more attention to this issue.
Read More: “A Tale of Two Networks: Common Ownership and Product Market Rivalry”
Learn more about our disclosure policy here.