

In new research, Sam Peltzman finds that Americans are significantly less happy than they were before Covid-19, even with the pandemic now in the rearview mirror. Those groups that had fared the best before Covid—white Americans, the wealthiest, college educated, and Republicans—were hit the hardest.
Happiness among Americans collapsed during the Covid-19 pandemic and has not recovered since. Using data from the General Social Survey (GSS), Sam Peltzman, a professor emeritus at the University of Chicago Booth School of Business and former faculty director of the Stigler Center, finds in a new working paper that declines in happiness have hit hardest white Americans, those with high incomes, the college-educated, and those who are politically right-leaning. Historically, these demographics have reported being the happiest. Before and after the pandemic, being married is one of the strongest indicators of happiness.
Peltzman’s new study, “The Happiness Crash of 2020,” is a sequel to his 2023 paper “The Socio Political Demography of Happiness.” The latter studied trends in happiness among Americans from 1972, when the GSS first started to measure survey participants’ levels of happiness, to 2018, the last full year before Covid.
In both studies, Peltzman measures happiness by subtracting the percentage of those who report being “not too happy” (what he labels “sad”) from the percentage of those who report being “very happy” (happy). He treats the third option, being “pretty happy,” as equivalent to “okay” and does not include this group in his calculation of net happiness.
From 1972 to 2018, about 34% of Americans reported being happy on average. About 12% reported being unhappy, and about 55% reported being ok. The net difference between those who reported being happy and those who reported being unhappy was 22%. This difference did shrink over time, and from 2012-2018 the difference compressed to 19% on average.
Then in 2020, the difference collapsed by 16.2 percentage points. Between 2021-2024, 23.3% of Americans reported being happy and 20.7% reported being sad, for a net difference of 2.7%.
Figure 1. Happiness 1972-2018 and 2021-2024
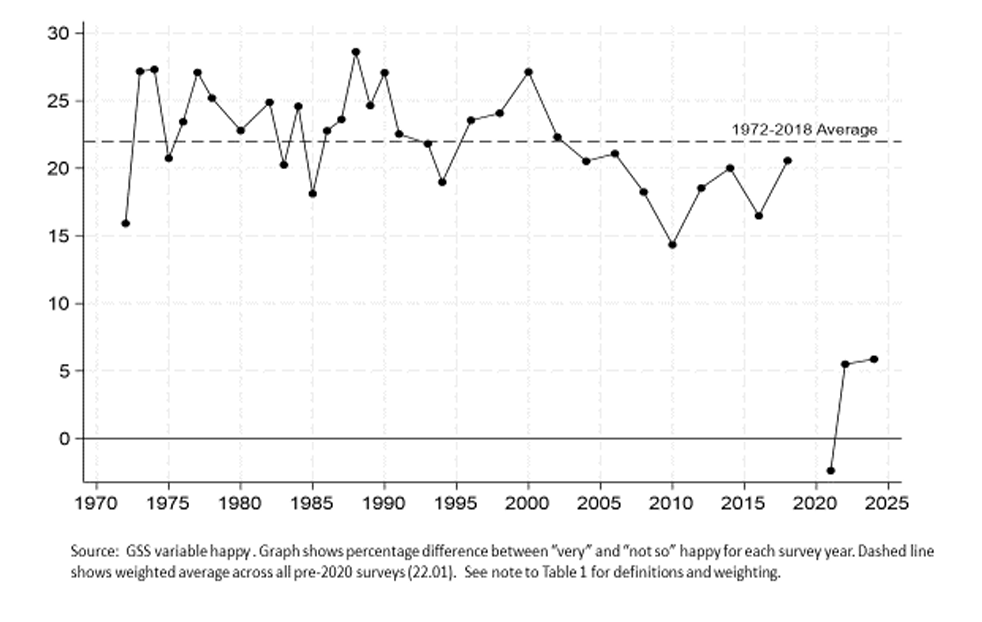
Both of Peltzman’s studies are descriptive in nature, and he does not hazard to surmise what is causing shrinking levels of happiness. However, the start of the Covid-19 pandemic is the obvious explanation for the plummet in levels of happiness, and indeed happiness does quickly bounce back somewhat from its 2021 lows.
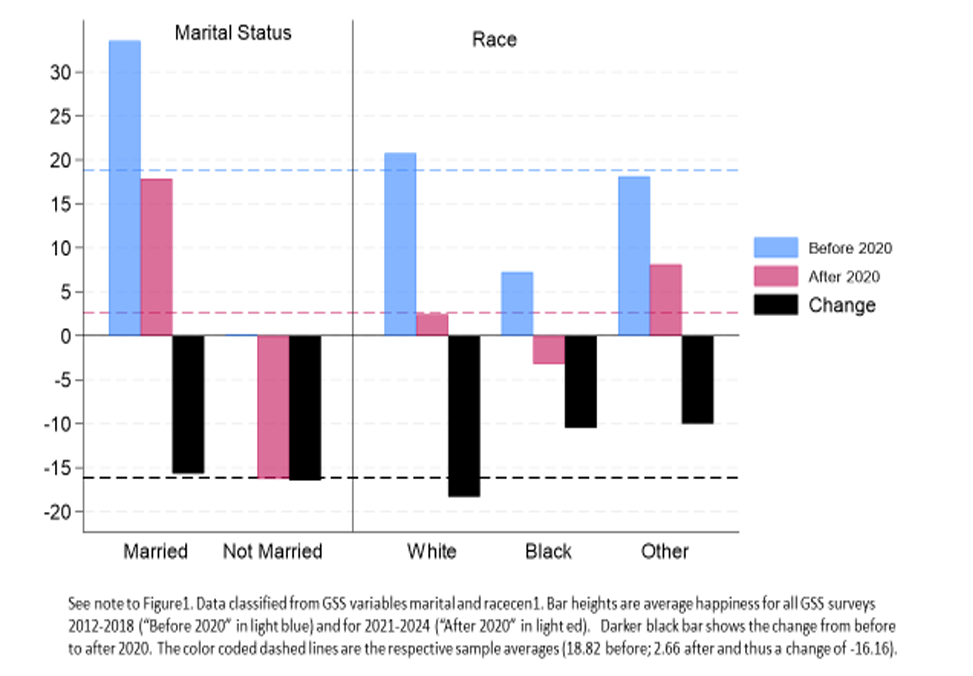
What’s less clear is why these drops in happiness hit hardest those demographics which had fared the best before Covid. Before Covid, Black Americans had reported the lowest levels of happiness among all races, with a positive net difference of about 7%. White Americans reported a positive net difference of about 21%, and all other races collectively reported a positive net difference of about 19%. After Covid, Black Americans still report the highest levels of unhappiness at a negative net difference of about 3%, for a change of about negative 10 percentage points. White Americans now report a net balance of 3%, for a total change of negative 17 percentage points. The “other” group now reports the highest levels of happiness at about 8% (having experienced its own drop of about 10 percentage points).
Figure 2. Happiness by Marital Status and Race. Before and After 2020
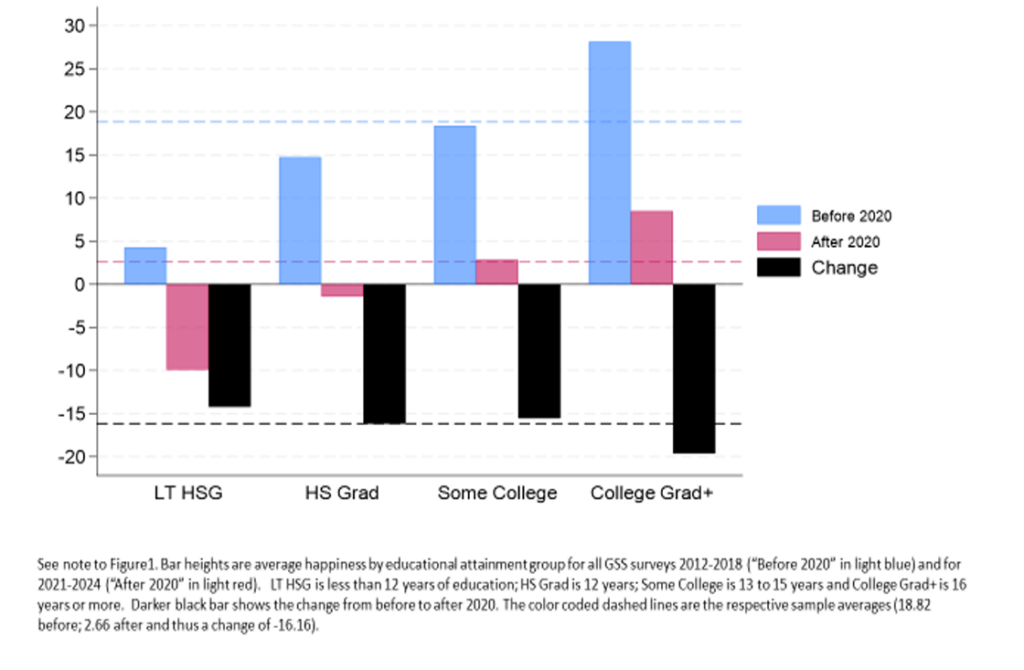
The most highly educated Americans show a similar drastic drop in levels of happiness. Historically, Americans who graduated college reported the highest levels of happiness, with those who did not graduate high school showing the lowest levels of happiness. This pattern still holds after Covid, but while those who did not graduate high school reported a change of negative 14 percentage points, those who graduated college experienced a drop of about 20 percentage points.
Figure 3. Happiness by Educational Attainment. Before and After 2020
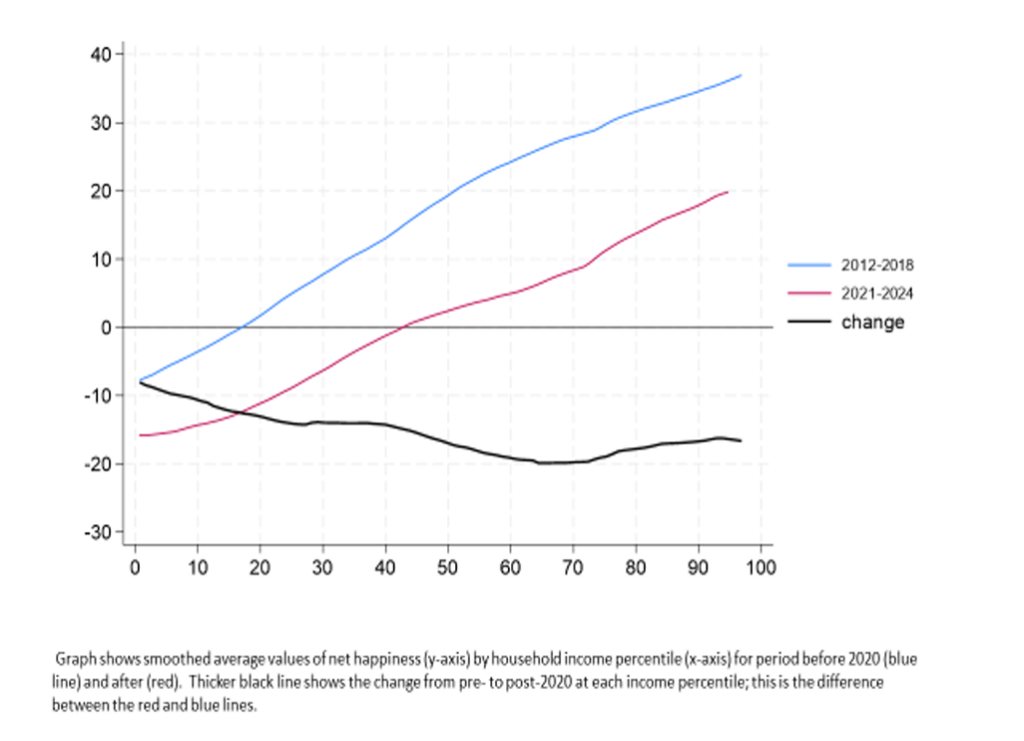
The wealthiest also reported a greater decrease in happiness than other income brackets. Like education levels, happiness observes a positive linear relationship with levels of income: The more one makes, generally the happier they are. After Covid, the two wealthiest income quintiles reported an average decrease in net happiness of 17 percentage points. The lowest quintile reported a decrease of about 10 percentage points.
Figure 4. Happiness by Income Percentile. Before and After 2020
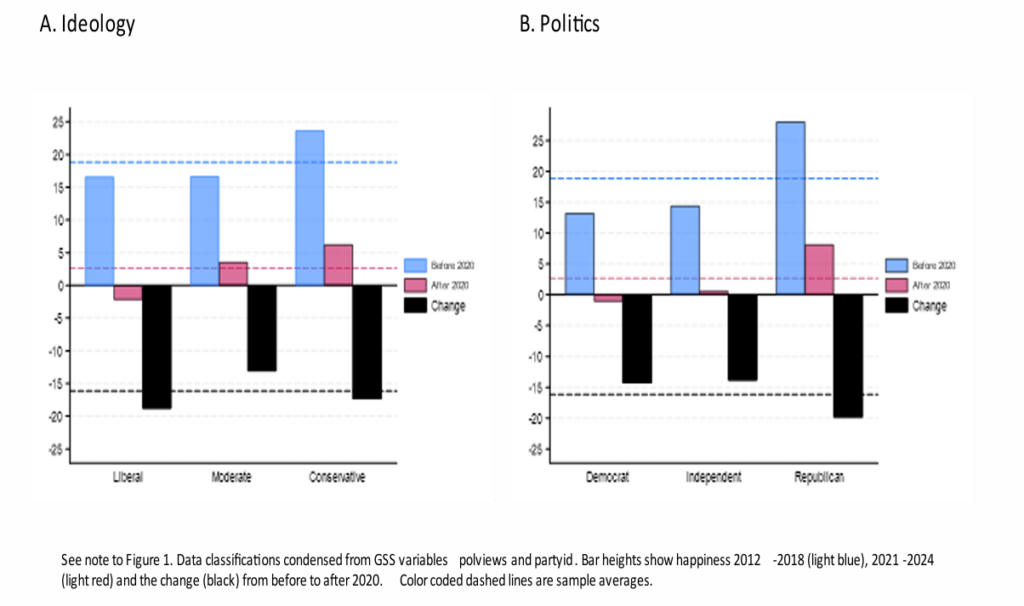
Lastly, Republicans have traditionally enjoyed a happiness premium compared to their moderate and liberal counterparts. Both liberals and conservatives reported similar decreases in levels of happiness after Covid, but Republicans reported a steeper drop than Democrats or independents (not all conservatives are necessarily Republicans, as not all liberals are necessarily Democrats). Republicans reported a net change of negative 20 percentage points, while Democrats and independents reported a decrease of about 15 percentage points. Republicans still reported being on average eight percentage points happier than unhappy, and Democrats are on average slightly unhappy.
Figure 5. Ideology, Politics and Happiness. Before and After 2020
Peltzman does not explain why Americans across the board are less happy now, four years after the start of Covid, than they were before. However, several variables he includes in his analysis stand out. The first is what Peltzman calls the marriage premium.
Prior to the pandemic, married adults were more than 30 percentage points happier than their unmarried counterparts. Both married and unmarried couples experienced about a 15 percentage point decrease in net levels of happiness during Covid; however, the 30 point difference between married and unmarried adults remained intact. Marriage still remains a key factor of happiness.
Peltzman cautions in his 2023 paper that his research does not explain why marriage increases Americans’ happiness. He writes, “is that because marriage produces happiness or because unhappy people tend to be difficult to live with or because they sort out of the marriage market and on and on or all of the above?” That marriage correlates with higher income levels, meaning wealthier people are more likely to be married, explains some of the premium. But the rest is unaccounted for. Peltzman explores the marriage premium in greater depth in a 2025 paper, “The Anatomy of Marital Happiness.”
Other variables Peltzman includes in his analysis that would intuitively relate to decreases in overall happiness include opinions Americans have of each other. Since Covid, Americans are significantly less likely to report believing they can trust other Americans (change of negative eight percentage points), that they are helpful (negative 6.5 percentage points) or are fair (negative 15.7 percentage points).
Americans also report less trust in their political, economic, and social institutions. The Supreme Court experienced the greatest swing in trust since Covid, with a change of negative 30.3 percentage points. Schools, religious organizations, medical institutions, and the scientific community all experienced changes of negative 13-15 percentage points, as did the military. Only banks and financial institutions came out of Covid fairing better.
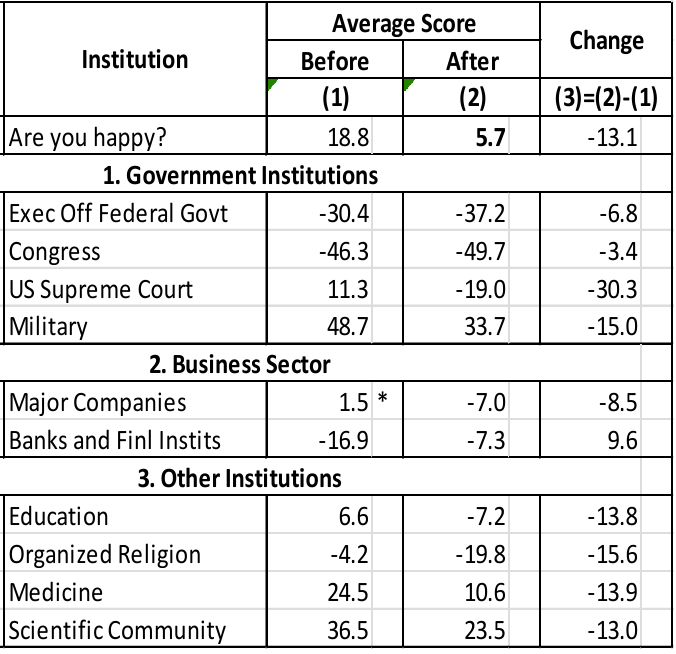
Exact specification of each institution is shown after the GSS name.
Answers are transformed to same scale as happy (shown for reference), i.e.percentage positive – percentage negative with neutral = 0.Here positive = a great deal, neutral = only some, negative = hardly any.
Sample size ranges: for column 1 (four surveys from 2012–2018) min 5767,max 5979; for column 2 (2022 and 2024 only, 2021 data are excluded)min = 4122, max = 4201.
* = not significantly different from zero at p < .05. All other values in all columns reject the null with p < .05.
Source: Sam Peltzman, “The Happiness Crash of 2020” (2026).
From the vibe economy to populism, disbelief in each other, capitalism, and democracy, Americans are unhappy with current circumstances. Peltzman’s new paper demonstrates how unhappy Americans have become and takes first steps at suggesting what is going wrong.
Author’s Disclosure: ProMarket Writers are employed by the Stigler Center, for which Sam Peltzman served as director from 1991-2005. You can read our disclosure policy here.
Articles represent the opinions of their writers, not necessarily those of the University of Chicago, the Booth School of Business, or its faculty.
Subscribe here for ProMarket’s weekly newsletter, Special Interest, to stay up to date on ProMarket’s coverage of the political economy and other content from the Stigler Center.