
")
Most users on social media have encountered toxic content: rude, disrespectful, or hostile posts or comments. A study using a browser extension estimates the effect of toxic content on user engagement and welfare.
The vast majority of social media platforms’ revenue comes from advertising. This business model relies on getting users to view or click on as many ads as possible. For this to happen, social media algorithms need to give users the type of content that makes them spend time on the platform and engage with ads.
This business model naturally raises concerns about whether platforms are incentivized to prioritize engaging but potentially harmful content. These concerns stem from seminal work in social psychology showing that negative events and emotions disproportionately impact human behavior. Thus, toxic content that is rude, disrespectful or hostile, though in principle unpleasant, might paradoxically drive more engagement.
In our paper, George Beknazar-Yuzbashev, Jesse McCrosky, Mateusz Stalinski, and I test this idea. We conducted a field experiment where we asked 742 users on Facebook, X, and YouTube to install a custom-built browser extension that tracked their activity on social media and other websites. Over six weeks in the summer of 2022, the extension randomly hid toxic posts and comments in real-time, generating a clean experimental variation in the users’ exposure to toxic content. This intervention mimicked platforms’ actual content moderation policies by using an algorithm to assign a toxicity score (ranging from 0 to 1) to text content and hiding posts and comments with a score of 0.2 or higher. This rule effectively hides content the algorithm predicts would be considered “toxic”—rude, disrespectful, or unreasonable—by at least 2 out of 10 people.
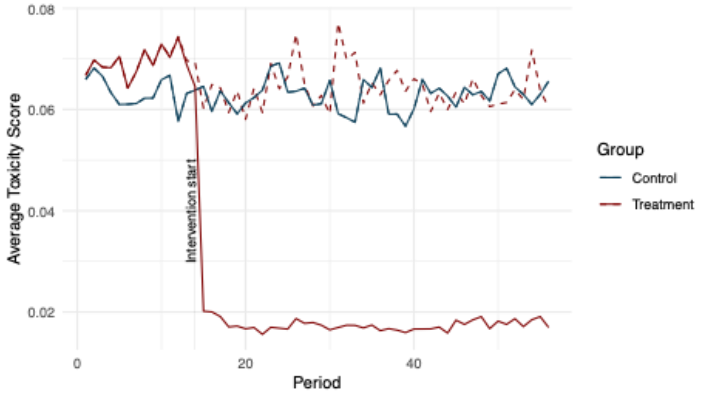
Figure 1 below shows that the study’s intervention substantially decreased users’ exposure to toxic content. The average toxicity score of content displayed to users in the treatment group was significantly lower than in the control group during the treatment period. The magnitude of this reduction is similar to the difference in the average toxicity of content encountered before the intervention occurred by users in the 50th and 2nd percentiles.
This figure also helps rule out the possibility that the algorithm “learned” to change the level of toxicity in the content it intends to display to users (represented by the dashed line). In theory, because users in the treated group would have interacted less with toxic content when it became hidden, the algorithm may have processed that change to mean users in the treated group stopped preferring toxic content and would begin to show them less toxic content instead. However, we see the algorithm continue to try to show those users in the treated group the same amount of toxic content as in the control group, despite our plugin hiding more of the toxic content. Additional analysis suggests that, besides the change in toxicity, our treatment did not significantly affect the composition of topics: the share of posts across 26 categories (including gaming, sports, and politics) remained virtually unchanged.
Figure 1
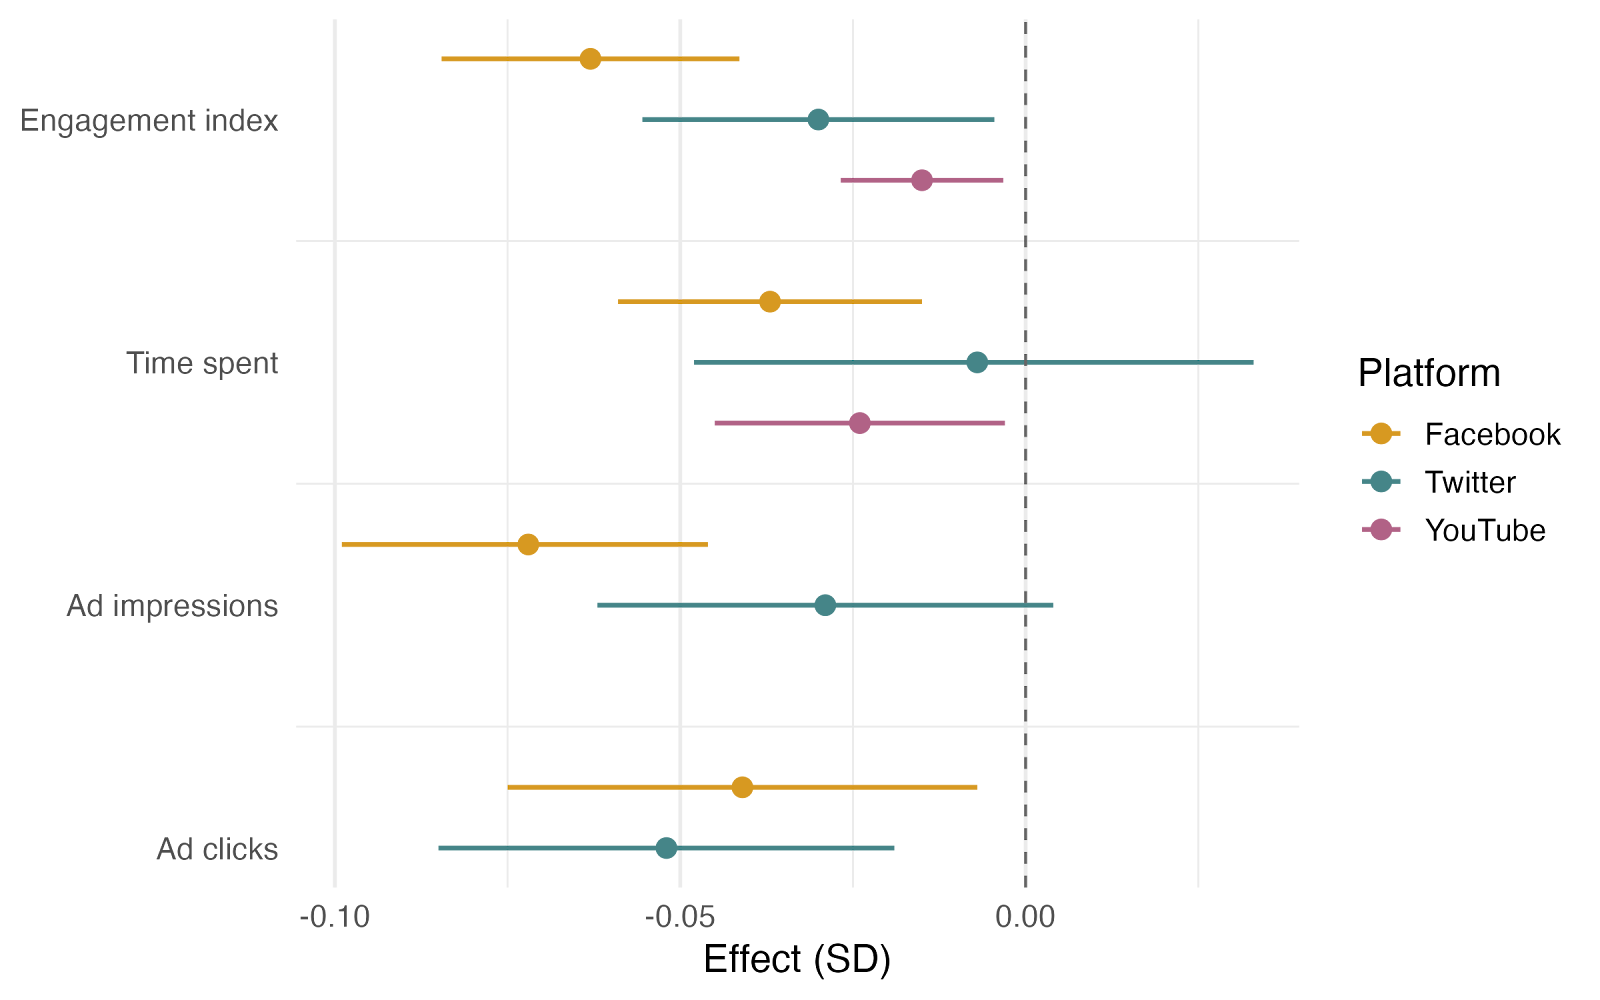
As a result of this intervention, we found evidence that lowering toxicity reduces engagement. On Facebook alone, users spent approximately 9% less time daily, experienced fewer ad impressions, and generated fewer ad clicks. Our preferred index that combines different metrics of engagement (active time spent, content consumed, reactions, posts, reposts, browsing sessions, ad impressions, ad clicks, and post clicks) fell by 0.054 standard deviations (a measure of the effect size relative to the variation in engagement across users) across all three platforms, with the stronger effects on Facebook, followed by Twitter and then YouTube.
Figure 2
Interestingly, users partly compensated for less engagement on Facebook, X, and YouTube by spending more time on alternative social media platforms, such as Reddit, indicating a substitution effect. This shift suggests platforms may be underinvesting in moderation if they fail to internalize spillover effects from reduced toxicity—the increased engagement with other platforms.
Another crucial finding is the contagious nature of toxicity. By hiding toxic posts that users saw (but never the ones they produced), the average toxicity of users’ subsequent posts that they made declined significantly. This finding implies that there might be a “multiplier” effect when combating toxicity, with reductions in exposure leading not only to immediate improvements in what users see but also to downstream improvements in what they themselves contribute.
What drives these effects? Should we interpret this decline in engagement as evidence that users are worse off in response to lower toxicity? To unpack the psychological mechanisms and welfare implications, we ran a complementary survey experiment with 4,120 participants. We varied the toxicity of the posts shown to users and measured their engagement (clicking to visualize comment sections) and welfare (how much money they would ask for to participate in a future task that required reading similar posts).
The results confirmed that toxicity sparks curiosity: respondents who encountered more toxic posts were 18% more likely to click to view the comment sections of the posts. Yet the impact on welfare was mixed, with some toxic posts decreasing welfare. Thus, engagement and welfare do not always align—negative content can simultaneously attract users and harm their overall experience. One should be wary about using changes in engagement as proxies for changes in welfare, as we also argue in a companion theory paper.
These insights offer one pessimistic implication: social media companies face a tradeoff. Platforms implementing similar interventions to the one we do with our browser extension could curb toxicity but at the cost of worsening different engagement metrics. On a positive note, these insights also suggest one potentially fruitful avenue for regulators: monitoring the different metrics recommendation algorithms optimize (see, for example, X’s algorithm) and measuring the extent to which they are aligned with users’ long-term welfare.
Author Disclosure: The author reports no conflicts of interest. You can read our disclosure policy here.
Articles represent the opinions of their writers, not necessarily those of the University of Chicago, the Booth School of Business, or its faculty.
Subscribe here for ProMarket‘s weekly newsletter, Special Interest, to stay up to date on ProMarket‘s coverage of the political economy and other content from the Stigler Center.