

In new research, Ricardo Marto finds that the rise of services in the United States explains the rise in firm markups over the last few decades rather than a lack of competition.
The surge in inflation from 2021-2023 renewed interest in competition policy as a tool to curb inflationary pressures. Recent evidence suggests that markups—the ratio between the price of a good or service and its (marginal) production cost—rose 11% between 1980 and 2015 in the United States. Upward trends are also visible across other advanced economies during this time. As markets become more concentrated, firms have more (monopoly) power to charge whichever price they want, elevating markups. Market concentration is thought to have allowed firms to increase their markups, which it turn contributed to an overall increase in prices—hence, the focus on competition policy.
In this article, I discuss the role of services in driving the long-term rise in prices and markups, going back to the 1980s. Why services? Like most advanced economies, the U.S. economy experienced a tremendous shift away from manufacturing toward services over the past four decades. Below, I first document that this shift in economic activity was accompanied by a rapid increase in the price of services relative to manufactured goods. Second, I show that the rise of markups in services has contributed to the increase in the price of services relative to goods. Finally, I point out that the rise in markups is at odds with a decline in competition and highlight the role of demand in driving the increase.
Which prices have escalated?
Over the past several decades, the price of services, such as healthcare, childcare, and restaurant dining, has gone up much faster than the price of manufactured goods, such as clothes and furniture. Figure 1a shows the price of services relative to goods. Relative to 1980, services are now between 51% and 58% more expensive than goods. Figure 1b depicts the inflation rate of different categories of goods and services relative to 2000. The trend in the relative price of services is driven by both a decline in the price of durable goods and an increase in the average prices of education, utilities, and food services, to name a few.
Household spending on services is now about 78% of personal consumption expenditures. It increased eight percentage points over the past four decades, driven by an uptick in the quantity of services consumed and the price of services. Households are thus spending less on goods, which are getting relatively cheaper, and spending more on services, whose relative prices have increased over time.
Figure 1: Prices of goods and services over time
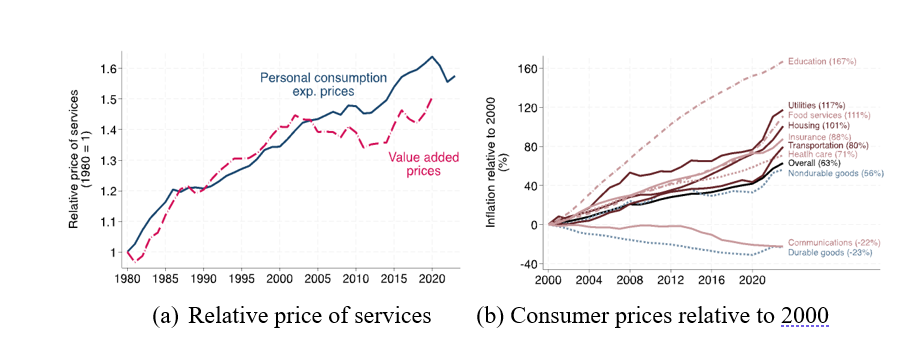
Source: BEA’s KLEMS and PCE data and author’s calculations.
Note: The left panel shows the relative price of services over time for value added prices and personal consumption expenditure prices. Prices are normalized to 1 in 1980. The right panel shows how the prices of selected goods and services have evolved over time by depicting the inflation rate relative to 2000.
Why are services becoming more expensive than goods?
Basic economic theory teaches us that firms set their prices to be equal to their (marginal) costs multiplied by a markup. In markets that are perfectly competitive, firms have little room to raise their prices above their costs and therefore markups tend to be close to zero on average. In contrast, in markets in which firms sell differentiated goods and services, a firm has some power to set its own price and its markup can be positive. In recent research , I show that about 65% of the 11% increase in markups since 1980 can be attributed to the rise in the average markup of services and about 7% to the increase in the services share. (The remaining 28% is attributed to an increase in the average markup of manufactured goods.) Table 1 shows that the average markup of services has grown faster than that of manufactured goods, despite being at similar levels in the early 1980s. Services are becoming more expensive than goods in part due to a stronger increase in the average markup of services.
Differences in prices also reflect differences in each sector’s cost structure. Marginal costs increase with higher wages, interest rates, and prices of intermediate inputs, and they decline as firms become more productive. Stronger productivity growth in manufacturing has allowed these firms to reduce their marginal costs and hence pass some of the efficiency gains on to consumers in the form of lower prices. This is less salient in the services sector, where productivity growth has been slower. Differences in fixed costs between manufacturing and services have played a lesser role. For instance, administrative and managerial expenses as a share of sales have grown at a similar rate across sectors.
Table 1: Average markups in services vs. manufactured goods

Source: BEA’s KLEMS and Compustat data, and author’s calculations.
Note: The table shows the average markup in sectors producing manufactured goods (non-services) and in services when the average markups are weighted by firms’ costs of goods sold and sales.
An increase in markups does not equal a decline in competition
Despite the recent rise in markups, the link between an increase in markups and a decline in competition is rather fragile. To understand this link, I build and estimate a model with two sectors where firms can charge markups and consumers differ in terms of income. In the framework, markups are responsive to changes in consumers’ incomes, firms’ productivities, the demand composition for the goods and services they sell, and the number of competitors they face. These channels emerge from allowing consumers’ willingness to pay for a good or service to vary with their incomes. As a result, firms’ markups are sensitive to both supply and demand forces. The model is then estimated to deliver the rise in markups, the services share, and the relative price of services observed in the past 40 years.
The upshot of the analysis is that technological progress was important in driving the rise in markups over the past four decades as it raised incomes, allowing consumers to spend more on new services, and simultaneously reduced firms’ marginal costs. As people became wealthier, commodities that were luxuries—such as services—became more accessible, and consumers’ willingness to pay for them increased. Figure 2 provides a synopsis of what the markup would be across three different experiments. First, if household incomes were kept constant at their 1980 levels, markups would have declined between 1980 and 2015. As consumers are now poorer, their demand for services becomes more elastic and they spend less on them. Second, if the prices of goods and services were instead kept constant, markups would have increased about half of what they did in the data. As productivity in the manufacturing sector is now lower, manufactured goods become more expensive, pushing firms to reduce their markups in response to increased marginal costs. Third, holding the costs related to market entry constant has less of a bearing on markups, despite increasing the number of operating firms. Markups would rise almost as much as they actually have, casting doubt on the view that declining competition and increasing barriers to entry are the main drivers of the rise in markups.
These findings are corroborated by survey evidence showing that demand becomes more inelastic as people become wealthier. In this study, I surveyed more than 600 consumers across the U.S. to assess how their demand for broad categories of goods and services responds to price changes. The key result is that less-well-off consumers are more likely to reduce their consumption demand when prices increase, while wealthier households are less pressured to adjust theirs. For instance, in response to a 20% price increase of childcare, 87% of households earning between $50,000 and $60,000 would expect to reduce their demand for such services, as opposed to less than 38% for households earning between $150,000 and $200,000. This pattern holds for different categories of goods and services across the income distribution.
Figure 2: Growth rate of the markup across different scenarios
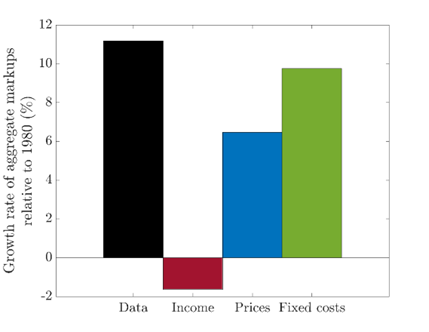
Source: Author’s calculations.
Note: The figure shows the growth rate of the aggregate markup in the data/baseline economy (black) and in the experiments with constant households’ incomes (red), constant prices (blue), and constant fixed costs (green).
Concluding remarks
With the rise of the services sector, the price of services has gone up much faster than the price of manufactured goods. At the same time, the average markup of services has also grown faster than that of goods, driving up the aggregate markup. There is, however, not enough evidence to argue that this was caused by a decline in competition. Consumer demand has played a far greater role in driving markups than what is usually believed. In some sense, markups go up inasmuch as consumers are willing to pay for them. The post-Covid-19 inflationary episode was remarkable in the sense that the supply chain disruptions led to strong goods inflation—here consumer demand played a lesser role—and a lot of the contact services were shut to the public—again, consumer demand was weaker. Once services reopened to the public, consumers were willing to spend their pandemic savings on services, creating upward pressure on prices and markups. Here, consumer demand did matter.
Author’s Note: The views expressed here are those of the author and do not necessarily reflect the views of the Federal Reserve Bank of St. Louis or the Federal Reserve System.
Articles represent the opinions of their writers, not necessarily those of the University of Chicago, the Booth School of Business, or its faculty.