

Madan Dhanora, Mohd Shadab Danish, and Ruchi Sharma review the history of the Indian government’s efforts to encourage innovation, how these efforts have manifested in the national pharmaceutical industry, and what steps the government can take to further improve innovation.
India is a prominent player in the global pharmaceutical industry. Per the Indian Ministry of Finance’s Economic Survey 2022-23, India ranks third worldwide in pharmaceutical production by volume and fourteenth by value. Renowned for supplying the most generic drugs worldwide, it commands 20% of the global market share for generics and is the foremost global manufacturer of vaccines, with a 60% market share.
India’s prominence in the pharmaceutical industry is due to a confluence of political-economic factors, particularly government investment in the 1980s and broader liberalization efforts in the early 2000s. In recent years, a spate of government initiatives such as Make in India (2014), Digital India (2015), Startup India (2016), Atal Innovation Mission (2016), and the Science, Technology, and Innovation Policy (2020) have further sought to build a favorable environment for firms in the pharmaceutical industry and in general to innovate.
However, between 2000-2021, Indian pharmaceutical firms, investing approximately 1.5% of their sales revenue in research and development (R&D), continued to lag behind foreign competitors in innovation, with the latter investing around 2.5% of revenue in R&D. The pharmaceutical industry’s shortcomings on this front are not just due to short-sightedness but are a result of various challenges that require a collaborative effort between India’s private and public sectors to overcome, including regulatory obstacles, financial limitations, lack of skilled human capital, and difficulties in collaboration and networking.
The development of Indian (Pharma) R&D: 1948-2010
The Indian government has a long history of investing in R&D. In the 1970s, public R&D accounted for approximately 0.35% of GDP. However, with the promulgation of the TechnologyPolicyStatement in 1983, the government established several institutions, such as the Technology Development Board, to promote and support the development of indigenous technology. In the 1980s, public investment in R&D doubled to about 0.60% of GDP.
One of the most significant determinants of India’s R&D environment has been its patenting regime. The Indian Patents and Designs Act 1911 centralized patent administration under the Controller of Patents. Subsequent amendments in 1920, 1930, and 1945 expanded protection, simplified the process, and extended patent duration. The India Patents Act of 1970 reversed some of these protections to reduce the social costs of foreign patents by (a) prohibiting patents on food and medicine, (b) shortening chemical process patent durations, and (c) significantly widening the scope of compulsory licensing. The act recognized patents for how a product was made (the manufacturing process) but not the end product itself. This encouraged pharmaceutical firms to reverse-engineer brand drugs to produce generics, since they would not need to pay royalties or fees for the drug itself. From 1970 to 1995, India’s domestic pharmaceutical industry grew from 2,000 firms to 24,000.
In the 1990s, and with the end of the Cold War, India faced sluggish growth and a balance-of-payments crisis. In response, the government liberalized the economy by joining the World Trade Organization in 1995 and signing the organization’s Trade-Related Aspects of Intellectual Property Rights (TRIPs). TRIPs guaranteed foreign firms’ patents, encouraging investment in India and foreign knowledge transfers to local scientists and commercial entities. As a result, foreign direct investment (FDI) into India increased from an average of $470 million between 1991 and 1994 to $2.7 billion between 1995 and 1998, peaking at $3.6 billion in 1997.
In addition to liberalizing, India established new laws, regulations, and government bodies to encourage further innovation, such as a volume-based R&D tax credit scheme in 2000. From 2001-2010, the government offered firms a 150% weighted tax deduction for capital and revenue expenditures related to R&D.
Perhaps most importantly, India replaced its process-based patent regime with a product-based regime in 2005. Indian pharmaceutical manufacturers now could and had to shift away from producing generic drugs to developing new, innovative ones. George and Usha Haley find that India’s new patent regime increased R&D in the pharmaceutical industry from USD $97.8 million in 2000 to $495.2 million in 2006. The number of industry patents filed also grew from 295 to 750 in 2007, although the growth was far from linear. In the overall economy, R&D in the private sector increased from 0.10% of GDP in 1990-91 to 0.22% in 2005.
Contemporary R&D in India: The pharmaceutical industry
Despite the government’s efforts, India continues to lag comparable nations in R&D investment. One notable aspect of India’s R&D investment is that, as of 2021, the public sector contributes approximately 65% of total R&D, whereas the private sector only contributes 35%. In other large industrial economies, the reverse is true. For instance, the private sectors in the United States and China contribute 60-70% of total R&D spending. The lack of private R&D investment may explain why India’s total R&D expenditure (0.70 % of GDP) is the lowest among all BRICS nations: China (2.20%), Brazil (1.20%), Russia (1.00%) and South Africa (0.80%).
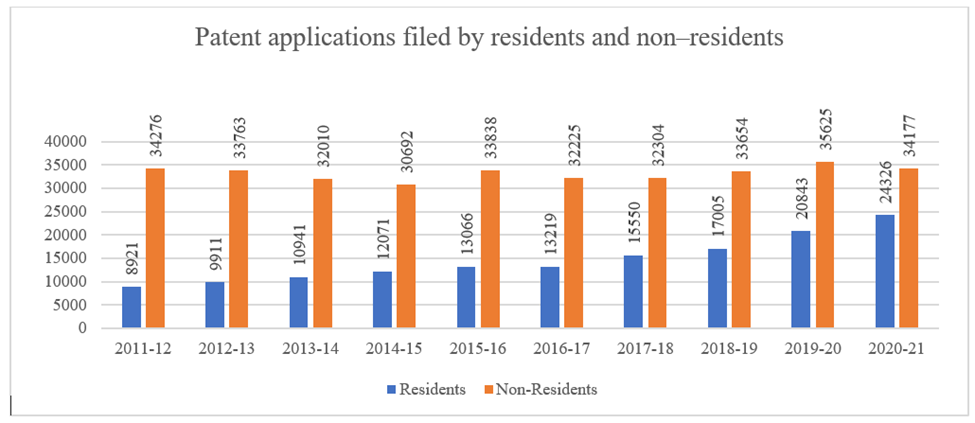
It may also explain why foreign patent inflows have historically been much higher in India than domestic filings. Promoting private R&D is essential to closing this gap. The pharmaceutical industry (domestic and foreign) submitted 5,622 applications and received 1,930 patent grants in 2020, compared to 871 and 320 grants in 2002. The total number of patents granted has also grown from 9,847 in 2016-17 to 20,074 in 2021-22. Encouragingly, the share of residents on these applications (as opposed to foreigners) has increased from 30% to 45% across the same period. Nonetheless, foreign patent filings in India still exceed domestic filings.
So, too, other metrics show how underdeveloped Indian pharmaceutical firms remain relative to foreign competitors. In 2020-21, just 14% of the 98,839 granted patents for all industries in India were commercially active, which is extremely low, although it is up from an average of 5.73% between 1990-1996 and 11.23% in the year 2010 (but down from 23.2% in 2017). This figure is 37% in the United States and 30% in China.
The term “technology gap” refers to the differences between firms’ technological capability, resources, and adoption of cutting-edge technologies in a particular industry. This gap represents a comparison between the total factor productivity of a specific company in an industry and the industry’s most productive company. The average technology gap of domestic pharmaceutical firms is around 0.70. A larger technology gap (one closer to 1.0) in domestic firms implies a substantial difference in technological capabilities or efficiencies compared to advanced firms, often led by foreign multinational corporations.
Lastly, major global pharmaceutical companies dedicate around 15% of their sales turnover to research and development (R&D). However, Indian pharmaceutical firms invest less, typically below 2% in R&D activities. Despite this general trend, certain companies like Dr. Reddy’s Laboratories Ltd. (13.7%) Sun Pharmaceutical Inds. Ltd. (12.4%), Cadila Healthcare Ltd. (10.1%), and Cipla Ltd. (8.5%) and stand out for their R&D investments.
The reasons for the struggle of Indian private R&D investment to catch up with global competition are manifold. One significant factor is that smaller domestic enterprises need help accessing capital due to high borrowing costs. In terms of sales volume, the average size of an Indian pharmaceutical firms is approximately USD $45 million, whereas the average size of U.S.-based pharmaceutical companies in India is roughly USD $258 million.
Furthermore, compared to the global average, India has the fewest skilled scientists and researchers per million people in the world. India had 255 researchers per million population in 2017, up from 218 in 2015 and 110 in 2000. With 8,714 researchers per million in 2020, the Republic of Korea ranks first among developed countries. The United States has 4,313, and China has 1,206.
Next steps to encouraging innovation
Through a combination of strategic measures, Indian firms can surmount budgetary limitations, address skills gaps, alleviate networking obstacles, and navigate intense market competition. A recent study by Olena Ivus, Manu Jose, and Ruchi Sharma underscores the interplay between government policies and private firms in shaping India’s innovation landscape. According to their findings, the enhancement of R&D tax deductions from 150% to 200% in the fiscal year 2010-11 led to an 11% rise in firm-level patent filings. New, targeted incentives may further boost private R&D spending.
The government can also promote industry–university collaboration by increasing targeted funding of universities and research organizations. Case studies exist in various industry sectors showcasing fruitful industry–university collaborations. One such instance is Tube Products of India partnering with the Indian Institute of Technology (IIT) Madras and IIT Bombay. Their collaboration focused on advancing tube technology, including metal forming, hydroforming, aluminum welding, and friction welding. This strategic endeavor aimed to facilitate the shift from steel tubes to aluminum tubes and develop innovative materials, ultimately reducing car weight. Similarly, Mahindra & Mahindra Ltd, a significant player in the automobile industry, collaborated with IIT Delhi to develop hydrogen technology for engines.
The success of university-industry collaboration relies on the availability of expert scientists within the universities who can engage in innovation. According to the All-India Survey on Higher Education conducted by the Ministry of Human Resource Development, total enrollment in higher education reached nearly 40.14 million in 2020–21, up from about 33 million in 2014-15. The gross enrollment ratio (GER) in higher education in India was 27.1 in 2019–20, which is much lower than China’s 51.6% gross enrollment ratio in higher education for the same period. The Indian government should reform its higher education system to promote the development of scientists and bridge the skills gap between domestic and foreign firms. To reap the demographic dividend, India must augment its R&D expenditure from 0.62 percent of GDP to match the levels of peer and developed nations. The possible route could be enhancing research collaboration infrastructure, strengthening national education policy, increasing tax benefits (tax credit policy on R&D), and incentivizing high-end technology startups in the country.
Articles represent the opinions of their writers, not necessarily those of ProMarket, the University of Chicago, the Booth School of Business, or its faculty.