

Bruno Pellegrino and Geoff Zheng explain how their novel methodology combining survey data and economic modeling can be used to quantify major questions, such as the economic loss from government regulation. This loss, they find, amounts to $154 billion in seven European countries each year.
Navigating the intricate world of government bureaucracy and regulations is a major challenge with which businesses around the world must contend.
In principle, regulations and bureaucracy fulfill the important function of limiting negative externalities, such as factory pollution, and setting the “rules of the game” of a well-functioning market (Williamson, 2001). However, they also impose a real cost on businesses. The size of these costs depends on which country a business operates in, as shown in pioneering work by Djankov et al. (2002).
Regulations (such as those that impose permits and licensing requirements) can distort firm investment and reduce GDP in two ways. First, by imposing a burden on companies that want to grow their business, they effectively act as a tax on capital, reducing overall investment. Second, because this “shadow tax” can vary a great deal across firms, they have the effect of misallocating capital and labor across firms, lowering aggregate productivity in the economy.
This begs an important question: is there a way to quantify this economic loss?
Various institutions (such as the World Bank, with its discontinued “Doing Business Index”) have tried to measure the impact of government red tape on firms. One typical way they do this is by surveying firms: namely, they ask some representative of the firm’s management to report the extent to which regulations pose an obstacle to their firm’s growth. This is usually done using a qualitative ordered scale (e.g. from “not at all” to “a lot”).
One problem with enterprise surveys is the qualitative nature of the response data they generate. To make a measurement of the GDP lost from red tape, we need to translate the firms’ qualitative responses into “shadow taxes.” Thus far, there has never been a methodology allowing us to do that. Another problem is that these surveys can contain a lot of noise (after all, whether red tape is a big obstacle or a small hindrance is at least to some extent the result of subjective assessment of the respondent).
In our paper, “Quantifying the Impact of Red Tape on Investment: a Survey Data Approach,” recently accepted for publication in the Journal of Financial Economics, we developed a methodology that combines firm balance sheet data, survey data, and simple economics to arrive at a measurement of the aggregate cost of red tape.
To arrive at these estimates, we used EFIGE, a firm-level database created by the Brussels-based think tank Bruegel. The dataset covers a representative sample of 14,759 manufacturing firms from seven European countries (Austria, France, Germany, Hungary, Italy, Spain, and the UK). In particular, we make use of a question in which firm managers are asked to identify the main factors preventing the growth of their firm. We refer to firms that indicated “legislative or bureaucratic restrictions” as a main factor as constrained firms, while firms that did not are considered unconstrained firms.
Our idea is based on a very simple equation that will be familiar to all readers who have taken an introductory class in economics: when deciding how much to invest, firms equate the additional revenue from an additional unit of capital (call it marginal revenue product of capital, MRPK) to the incremental cost per unit of capital (let’s call it R), plus any tax let’s (call the tax rate 𝜏):
MRPK = (1+𝜏) R
With some assumptions, we can estimate MRPK for many firms using accounting data. We can then visualize the distribution of MRPK for all firms in a certain country.
Now, take a country in our dataset (say, France), and consider comparing the distribution of MRPK for two different set of firms (controlling for sector and other firm characteristics) namely: 1) firms that report red tape as a significant hurdle in the EFIGE survey; 2) firms that do not report red tape as a significant obstacle in the EFIGE survey. If indeed government regulations induce significant shadow taxes (𝜏), the equation above suggests that, for those firms, we should observe a right “shift” in the distribution of MRPK in the data, meaning that the marginal revenue for each additional unit of capital must be relatively higher than it would have been absent the impact of red.
Our methodology consists of measuring the resulting “shift” in the distribution of MRPK, and using it to estimate the statistical distribution of the shadow taxes (𝜏) induced by red tape.
FIGURE 1: Distribution of MRPK
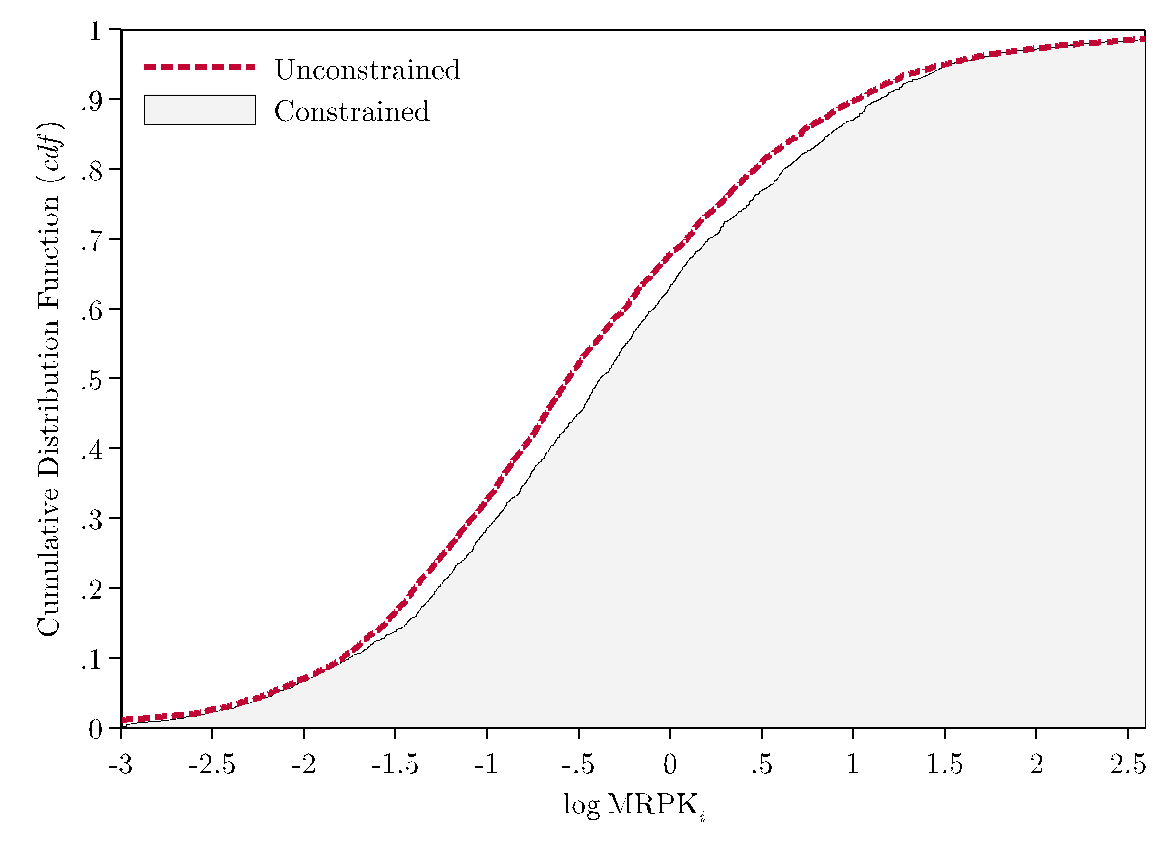
Figure 1 plots the empirical estimate of the cumulative density function of (the log of) MRPK, separately for constrained and unconstrained firms. The red dashed line corresponds to those firms that report being unconstrained by red tape, while that plotted as a shaded area corresponds to firms that report being constrained by red tape. The “right” shift in the distribution of MRPK is clearly visible, and consistent with the idea that red tape acts like a tax on firms’ capital decisions.
Our methodology translates this shift into a statistical estimate of the distribution of the shadow tax (assumed to be a Gaussian distribution), which can be seen in Exhibit 2 for the five largest countries in our database.
EXHIBIT 2: Estimated Distribution of τ

We can then input each of these distribution estimates in a standard macroeconomic model with heterogeneous firms who invest, and finally arrive at an estimate of how removing the distortions associated with red tape would change aggregate productivity and investment.
EXHIBIT 3: Estimates of the GDP Cost of Red Tape

When we do this, we find that, across the seven countries in our dataset, the economic cost of red tape exceeds 154 billion USD each year. Thus, red tape has huge costs, even in advanced economies. Furthermore, when we look at the country-level estimates, we find substantial heterogeneity – the cost of red tape varies widely across countries: it can be as low as 0.10% of GDP, as in the United Kingdom, or as high as 3.9% of GDP, as in France.
Beyond the simple measurement, an important contribution that we sought to make to the literature is the methodology. The approach developed in this paper can be used to estimate the effect of other types of distortions. One way to expand this line of research, which we see as particularly promising, is to design novel enterprise surveys that are built specifically to calibrate general equilibrium models with firm-level frictions. Central Banks and Censuses (who manage business registry data and run enterprise surveys on a recurrent basis) are among the entities that can most easily accomplish this. We believe that having a quantitative framework in place to take advantage of firm-level survey data can provide valuable guidance on how to design enterprise surveys for maximum robustness and statistical power.
Articles represent the opinions of their writers, not necessarily those of the University of Chicago, the Booth School of Business, or its faculty.