

There are concerns among bankers and economists that commercial real estate prices are at risk of decreasing substantially. Joseph L. Pagliari, Jr. explains how commercial real estate should be priced based on current and projected inflation and interest rates. A subsequent article will explore if concerns about bank and broader economic vulnerabilities to lower CRE prices.
With three of the four largest U.S. bank failures (amounting to more than $500 billion in assets) in history occurring earlier this year, there is renewed focus on the current pricing of commercial real estate (CRE). According to Moody’s, total CRE debt outstanding is approximately $6 trillion, and banks hold the largest share with nearly half of that. What is more, banks also hold the largest share of those CRE loans maturing in 2023-2026, suggesting the potential for significant “rollover” (or refinancing) risk.
Since CRE assets represent a significant asset class, many fear that falling property values could have severe consequences for the banking sector, city centers and their budgets (the doom loop), and, among other socioeconomic considerations, the broader macroeconomy (I will revisit several of these considerations in a subsequent article). To evaluate how well-founded these concerns are, this article attempts to calculate how the pricing for institutionally and privately owned “core” assets (i.e., well-built, -leased and -located apartment, industrial, office, and retail properties) is reacting and will likely react in the near term to the recent spike in inflation, interest rates, changing use patterns, etc. During a market downturn, private-market transaction volume slows markedly. As such, it is difficult to precisely estimate market-clearing asset prices. Therefore, private asset prices are essentially viewed through the prism of “mark to model” in such instances. These potential pricing fluctuations provide some general sense of the exposure of banks and other lender types to a market downturn.
Nominal v. Real Rate of Interest
With the annual inflation rate surging to 40-year highs, the accompanying increase in nominal interest rates has contributed to today’s angst about real estate prices. Higher interest rates increase the cost of borrowing to purchase property and increase the attractiveness of other investments, such as Treasury bonds. The net effect is a reduced demand for property, thus lowering property prices.
This article, based on earlier work, tackles several misconceptions that abound in this tumultuous period and derives a range of reasonable property prices that would support a range of plausible near-term capitalization rates and, therefore, prices. Loosely, a capitalization rate is the ratio of a property’s estimated net operating income (before interest, depreciation, and other capital charged) divided by the asset’s price. It is similar to an EBITDA yield in the stock market or a coupon yield in the bond market. Accordingly, capitalization rates and prices move inversely.
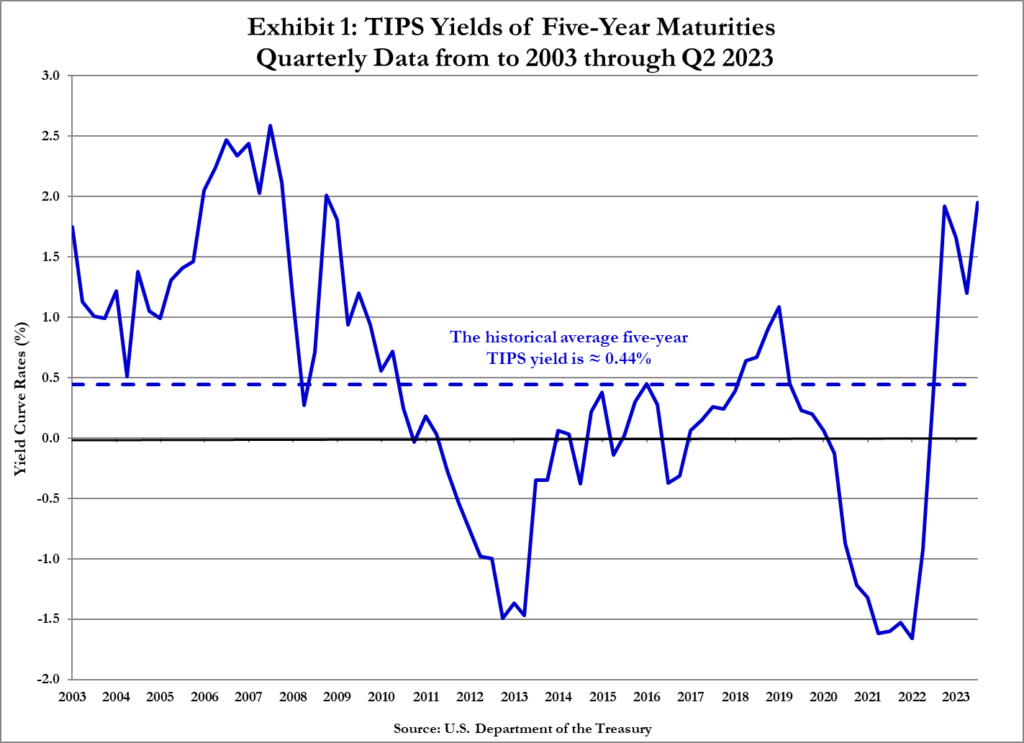
The first misconception derives from a misunderstanding of the role of nominal versus real rates of interest. The nominal interest rate reflects a combination of inflation expectations, uncertainty about future inflation, and a real-return requirement (i.e. the return of an asset indexed to inflation). However, it is the real rate of interest that matters most when considering the pricing of income-producing properties. The real rate of return sets the floor by which astute real estate investors consider anticipated returns (i.e., such investors expect a significant spread – net of any fee/cost differentials – over the bond market’s real return, reflecting the higher costs and risks associated with CRE assets. Furthermore, the real rate of return – as proxied by the yield on the five-year Treasury Inflation-Protected Securities (TIPS) – has shown significant increases of late (approximately 360 basis points in 18-months’ time); see Exhibit 1:
The basic intuition behind the central importance of the real yield is that income-producing properties have cash-flow streams that are indexed to inflation. In ideal instances, those income streams are perfectly indexed to inflation and, as such, there’s no need for a change in the property’s price when there is a change in the anticipated inflation rate (i.e., any increase in the nominal interest rate or discount rate is perfectly offset by increases in anticipated cash-flow growth). However, it is the rare instance that real estate’s cash flows are perfectly tied to inflation.
“Mainstream” finance generally identifies the excess return for publicly traded equities by reference to the 30-day Treasury-bill return. The excess return is the spread between the nominal return on an asset in comparison to the interest one would earn from investing in, generally, a short-term Treasury bond. The excess real return for privately held real estate can likewise be identified by reference to the (maturity-appropriate) TIPS yield. However, there are two important distinctions between public securities markets and private property markets: One, because of the infrequent trading of private real estate holdings, a long-dated risk-free rate is appropriate. Two, because of the inflation-hedging characteristics of real estate, the real rate of return on the risk-free security (i.e., the TIPS yield) is the more appropriate reference rate. Said another way, when real estate’s income growth is perfectly indexed to inflation, inflationary increases in the nominal Treasury rate have no bearing on real estate’s price; consequently, it is the real rate of return that deserves our focus.
Historically (see Exhibit 2), the average realized (pre-fee) unlevered total inflation-adjusted return on institutionally owned core real estate is approximately 5.2%. It is also important to note that the average dividend payout ratio (the pre-tax unlevered cash flow as a percentage of net operating income) and the average inflation pass-through rate (NOI growth divided by the inflation rate) are both (coincidentally) approximately .67. Assuming that the past is prologue to the future, these three statistics help inform how we might reasonably price real estate.
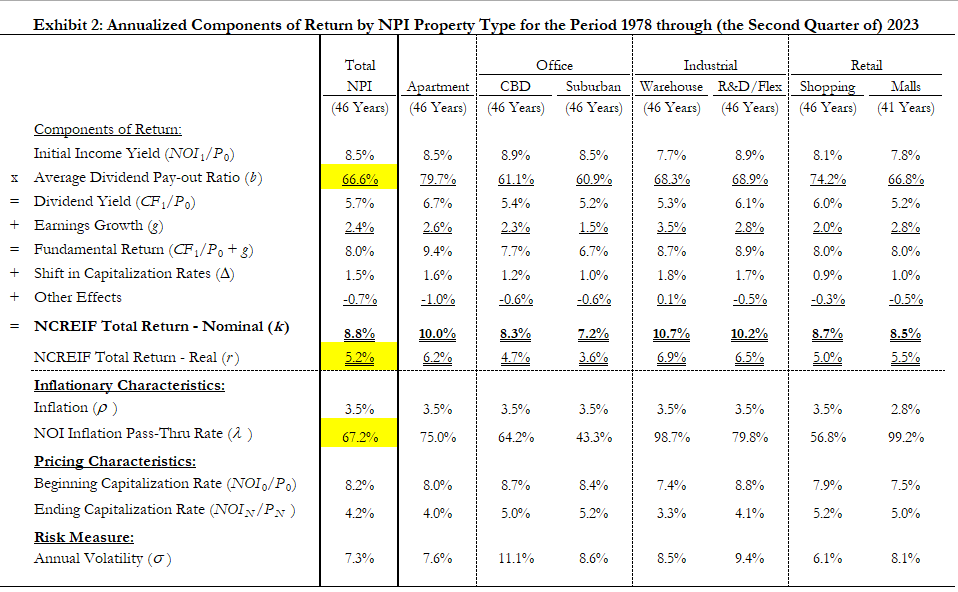
These figures (a historical real return of 5.2%, a dividend payout ratio of .67, and an inflation pass-through rate of .67) help pin down our estimates of future near-term capitalization rates.
The Market’s Consensus View of Future Inflation
There is one other element that needs to be considered when pricing real estate, and that is the capital market’s consensus view of future inflation. That view can be extracted from either the spread between the nominal Treasury bond and the TIPS yield, which provides the so-called “break-even” inflation rate, or the derivatives market (e.g., options, forwards, swap spreads, etc.) for Treasury bonds can be inverted to provide an estimate of the future inflation rate.
As to the former, there is a robust and longstanding literature positing that the term structure of today’s interest rates represents the market’s consensus view on the evolution of future interest rates. This is true of both the current nominal and real interest-rate term structures.
Exhibit 3 utilizes this “expectations theory of interest rates” to generate estimates of the five-year forward rates and provides a comparison of the 5-year forward interest rates on both nominal- and real-yielding Treasury bonds; the difference between these forward interest rates is the “break-even” inflation rate (i.e., the spread between the nominal and real returns on Treasury bonds representing the expected inflation rate and a premium for the uncertainty of future realized inflation rates – neither of which is directly observable).
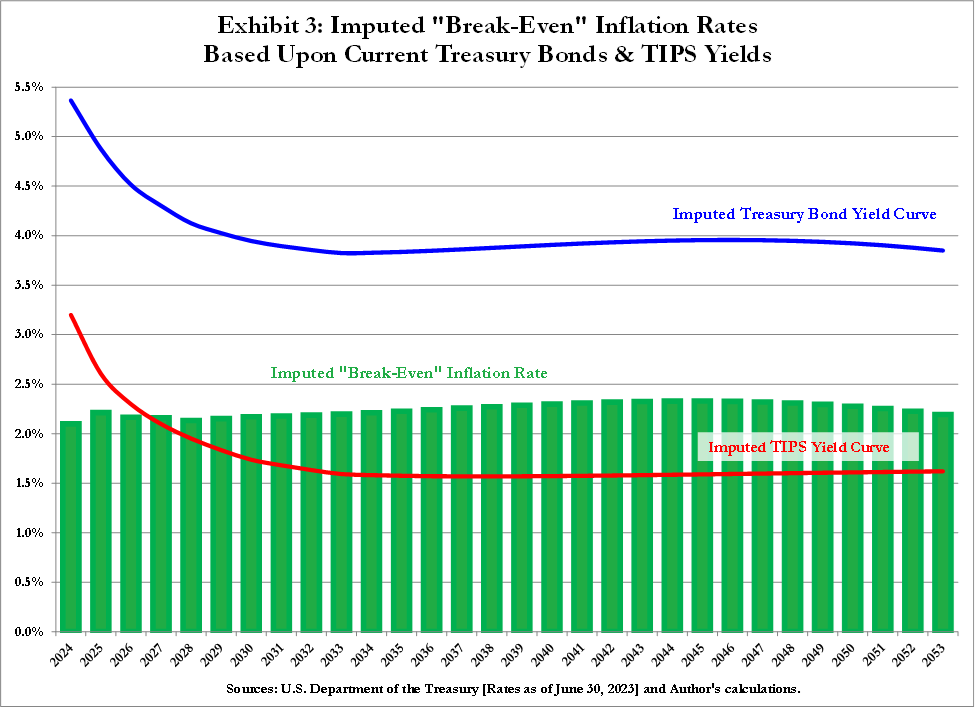
This exercise suggests that the market’s consensus mid-year view of the long-term break-even annual inflation rate is approximately 2.2%.
While a detailed description of the second approach is beyond the scope of this article, the Federal Reserve Bank of Minneapolis provides updated derivatives-based estimates of the probabilities associated with a variety of current and future macro-economic measures (e.g., five- and 10-year Treasury rates, S&P 500 over the coming 6 and 12 months, various commodity prices, etc.) – including, most importantly for our purposes, the Consumer Price Index (CPI) over the coming five-year period. Exhibit 4 summarizes the derivatives market’s estimate of the future inflation rate:

As shown above, the most-recent derivatives-implied estimate of the median increase in CPI over the coming five years equals 2.19%. Merely for reference, Exhibit 4 also provides the same estimates from a year earlier. The market’s consensus median estimate of inflation has lowered over the prior 12 months by 69 basis points (and by 54 basis points with regard to the mean).
Comfortingly, both approaches, however imperfect, produce similar estimates of the future changes in CPI (≈ 2.2% per annum) over the coming five years.
Estimates of Where Cap Rates Ought to Come to Rest:
Now, we can assess a reasonable range for CRE prices. Based on current estimates of core mid-year capitalization rates of 6%, we can calculate (see here for the equations used for these calculations), an estimate of the year-end (unlevered) cash-flow yield of 4.0% (the product of a 6% capitalization rate and a .67 dividend-payout ratio). Given the market’s consensus expectation of the future inflation rate of 2.2%, and the historical inflation pass-through rate of .67, we then solve for real estate’s expected real return, which we find to be approximately 3.2%. It should also be emphasized that, while these figures represent average values for a portfolio of core real estate, there may be stark differences by property type (e.g., see Exhibit 2).
The current estimate represents a deficit of approximately 200 basis points when compared to the historical real return on (unlevered, institutional-grade, core) real estate, which has averaged approximately 5.2% (as highlighted in Exhibit 2) before investment management fees and costs. Moreover, the current estimate (3.2%) of the real return on real estate is about 125 basis points above the mid-year 5-year TIPS yield (of ≈ 1.95%). The 125-basis-point differential seems insufficient to offset the fees in a core fund (estimated to be approximately 75-100 basis point per annum (e.g., see: Pagliari (2020)) and to provide a risk premium for the volatility associated with holding real estate; of course, opinions will vary.
Reversing the equation to calculate what the capitalization rate would need to be if real estate investors require an expected 5% (pre-fee, unlevered) real return on core real estate gives us a capitalization rate of approximately 8.75%. At this capitalization rate, property values would fall by more than 30% (given an initial capitalization rate of 6.0%).
Assuming that today’s spot-market capitalization rate is 6.0% (and given the calculations sketched above), the (equal-weighted) average valuation change is a fall of approximately 30%; the range of valuation changes span roughly 0% to –50% (due to price convexity, price changes are not linear in cap-rate changes). See Exhibit 5:

The potential for these adverse changes is what gives bankers, regulators, investors, etc. trepidation. Crudely, mortgage loans will be “underwater” when the debt’s loan-to-value (LTV) ratio exceeds the ratio of the beginning and ending capitalization rates. In fact, the Federal Reserve released earlier this year its 2023 stress testing scenarios, used to gauge the banks’ ability to withstand both baseline and severely adverse economic outcomes in the calendar year. Their “severely adverse” projection forecasts that commercial property values will fall nearly 40% (from the fourth quarter of 2022 to the end of 2023) – mostly concentrated in offices, (business-oriented) hotels, shopping malls and strip malls. A forecast not terribly at odds with what is conjectured here.
In that spirit, let’s consider the possibility that the TIPS rate reverts to a level consistent with its long-run average, which is approximately 0.44%. If we rerun the earlier calculations with a lowered TIPS yield, the (equal-weighted) average capitalization rate is now anticipated to be approximately 5.85%. The average valuation would increase by nearly 10% (instead of falling by approximately 25% with capitalization rates at 6.0% and the TIPs rate at 1.95%).
Yet another way of considering the valuation-change question is to ask: How far must the TIPS yield fall in order for today’s capitalization rate to represent the market-clearing capitalization rate such that average valuation change equals zero? The short answer is that the TIPS yield would have to fall to approximately -0.25% per annum. Perhaps not coincidentally, this was the approximate TIPS yield in early 2020 – suggesting that real estate was more or less rationally priced just before the COVID pandemic. To oversimplify, virtually any fall in the TIPS rate would help propel real estate upward (not downward) from current prices.
Concluding Remarks
In order to examine the potential risk of significant repricing of commercial real estate, this article has argued for the primacy of the real required return on Treasury bonds as setting the foundation for where capitalization rates and, therefore, prices ought to come to rest. At present, the market apparently seems willing to accept lower ex ante real returns, forecasts higher cash-flow-growth rates and/or believes (or, at least, hopes) that TIPS rates will settle lower. Perhaps some or all of these factors will be realized. On the other hand, the slow-moving nature of private markets upon the advent and during a market downturn may have yet to reveal the true magnitude of commercial real estate’s repricing.
In any event, current conditions give rise to concerns about whether a market downturn is likely to lead to a “hard” or “soft landing.” Absent some motivating circumstance (e.g., increased global military conflicts, a collapsing banking/financial system, an avalanche of maturing mortgage loans, etc.), it would seem that most property owners (not facing a near-term payment and/or maturity default) will be content to bide their time (i.e., the optionality of their levered-equity position is best served by waiting); if accurate, the repricing of real estate is likely to play out more slowly – arguing for a soft landing (by comparison to “fire sale” prices induced by significant distress in the market).
Articles represent the opinions of their writers, not necessarily those of the University of Chicago, the Booth School of Business, or its faculty.