

In new research, Enghin Atalay, Alan Sorensen, Christopher Sullivan, and Wanjia Zhu find that mergers and acquisitions often lead to the merged firm offering less product variety than when the two firms operated pre-merger.
In 2022, mergers and acquisitions (M&A) in the United States totaled $2.4 trillion. M&A offer acquiring firms the unique opportunity to leverage their managerial know-how over a wider set of product or geographic markets. At the same time, the consolidation induced by M&A poses a perennial concern for policymakers regarding product price, quality, innovation, and, to be explored in this article, variety.
How firms choose their post-M&A product portfolios sheds light on the synergies and cost reductions that mergers afford as well as the potential harms to consumers through reduced product availability. According to one set of models, M&A afford merging firms the opportunity to discontinue closely competing products so as to reduce costly duplication and profit-reducing product market cannibalization. According to others, M&A allow firms to quickly scale up in certain product segments. As some of the acquired product lines will not align with the merged firm’s core competencies, these theories would predict substantial post-merger churn, with the products that are far from the center of the merged firm’s portfolio more likely to be spun off or shuttered. Models within this second set predict that consumers will have access to a narrower range of products, and thus a decline in consumer surplus above and beyond higher prices that may result from the merger.
Earlier research provides evidence consistent with each of these points of view. On the one hand, Vojislav Maksimovic, Gordon Phillips, and N.R. Prabhala document that nearly half of plants purchased in manufacturing acquisitions are shut down or spun off within the three years following the M&A with, crucially, plants in peripheral industries (i.e. those outside the firm’s core markets) significantly less likely to be retained. On the other hand, in their analyses of mergers among radio broadcasters, Steven Berry and Joel Waldfogel and Andrew Sweeting find a post-M&A increase in product variety.
In a new paper, we consider the evolution of merging firms’ product portfolios in a sample of 66 M&A among firms in the consumer packaged goods sector. As in the work of Maksimovic, Phillips, and Prabhala, our sample draws on a wide variety of product markets. Like the analysis of Berry, Waldfogel and Sweeting, we consider the varieties that consumers have access to, looking within detailed product markets. In our paper, we establish three main empirical patterns:
- First, merging firms reduce the number of products they sell, with the effects materializing one year after the M&A and accelerating over the next several years.
- Second, merging firms tend to drop and add products at the periphery of their joint product portfolio.
- Third, the net effect is an increase in the similarity among the products that firms offer following a merger or acquisition.
Data Construction and Measuring Product Assortment Similarity
To arrive at these results, we construct a sample of mergers and acquisitions among consumer packaged goods manufacturers in the food-and-beverage industry. We identify M&A consummated between 2006 and 2019 using the Securities Data Company (SDC) Platinum Mergers and Acquisitions database. We focus on horizontal mergers involving firms that produce at least some similar products (e.g., a merger of two cereal manufacturers as opposed to a cereal and a frozen pizza manufacturer) and for which the acquiring firm purchases a 100 percent stake of the target firm (or a subset of the target firm’s lines of business). Using the NielsenIQ database—which, during our time period, contains detailed information on products sold in more than 35,000 participating grocery, drug, mass merchandiser, and other stores—we can then determine the set of products offered by these firms before and after they merge. Our final sample includes 66 mergers and acquisitions, covering 361 M&A-by-product market pairs.
A key step in our analysis of product portfolios is to define the dissimilarity (“distance”) between any two products in our dataset. We employ two approaches, one that relies on abbreviated product descriptions provided by NielsenIQ, and an alternate that relies on purchase patterns of individual households whose purchases are tracked by NielsenIQ. In the first approach, two products with a high fraction of the same keywords in their product descriptions are classified as close to one another. In the second, the similarity between two products is based on how commonly they are purchased by the same household.
As an illustrative example, consider Nestlé’s 2010 acquisition of Kraft’s frozen pizza brands. Two of the acquirer’s (Nestlé’s) products are Stouffer’s Deluxe French Bread Sausage, Pepperoni, Mushrooms and Onion Pizza and DiGiorno Thin Crust Four-Cheese Pizza. The target firm (Kraft) produced a Tombstone Original Deluxe Sausage, Pepper, Onion, and Mushroom Pizza. Our first product-description approach would say the Tombstone pizza is closer to the Stouffer’s pizza than to the DiGiorno pizza based on the overlapping terms “deluxe,” “sausage,” “mushrooms,” and “onions.” Further, suppose that in the consumer panel, which tracks households over time, we observe that 50 percent of the households that regularly purchase the Tombstone pizza also purchase the DiGiorno pizza at least once, while only 5 percent of these “Tombstone households” purchase the Stouffer’s pizza. Our second household-purchase approach would likewise conclude, directly from the consumers’ behavior over time, that the Tombstone pizza is closer to the Stouffer’s pizza.
What Effect Have Mergers Had on the Number of Products Sold?
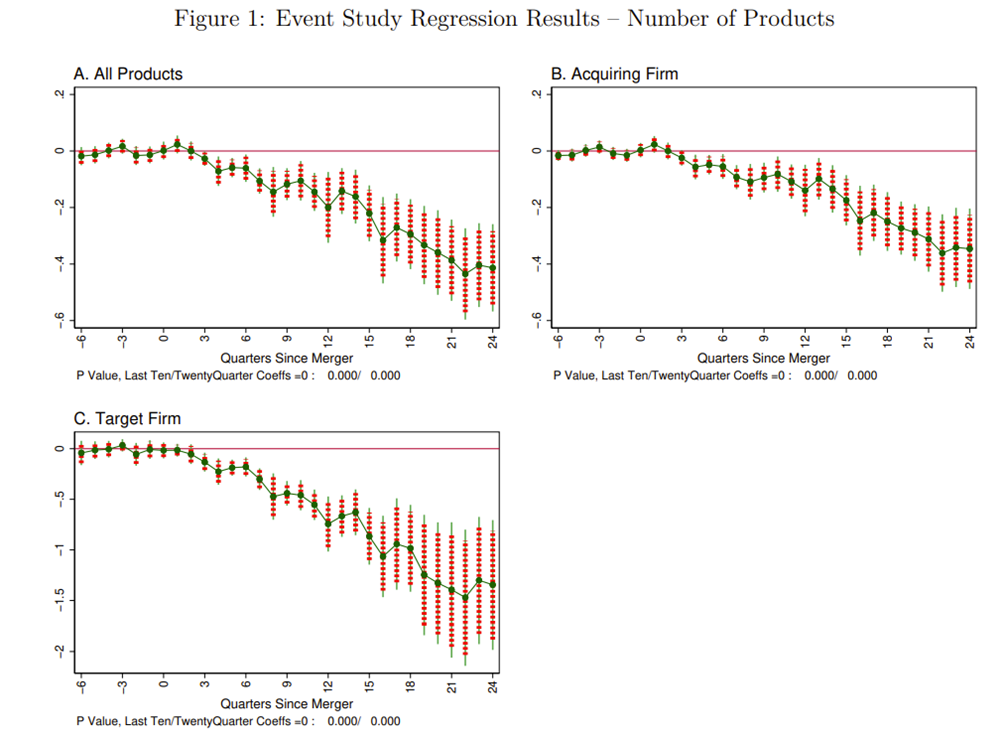
Using an event study empirical methodology, we first compare the total number of products offered by the merged firms in our sample up to six years after the M&A to the combined number of products offered by the merging firms directly before. Figure 1 plots changes in the logarithm of the number of products at the firm-by-product-market level around the time of each M&A.
Mergers are associated with significantly fewer products sold, but only with a lag. (The red-dashed line and thin-solid-green line give, respectively, 90 and 95 percent confidence intervals.) According to Panel A of Figure 1, the number of products sold begins to fall about one year after the M&A, accelerating thereafter. By four years after the M&A, the merging firm is selling 40 percent fewer products.
These net changes are negative both for products originally sold by the acquiring firm and for those sold by the target firm (in Panels B and C of Figure 1, respectively), but with substantially larger effects for those related to the target firm. Finally, we find that merging firms’ product portfolios neither shrink nor grow in the year and a half prior to the M&A.
How Does Product Variety Change After A Merger?
The net reduction in the number of products offered by merging firms may still be consistent with either higher or lower product variety. For example, if the merging firms eliminate many similar products to avoid cannibalization while adding a few products in the periphery of their product space, then variety increases. Instead, if the merged firm predominately drops products which are on the periphery of its portfolio while slightly expanding its offerings in the core, then variety decreases.
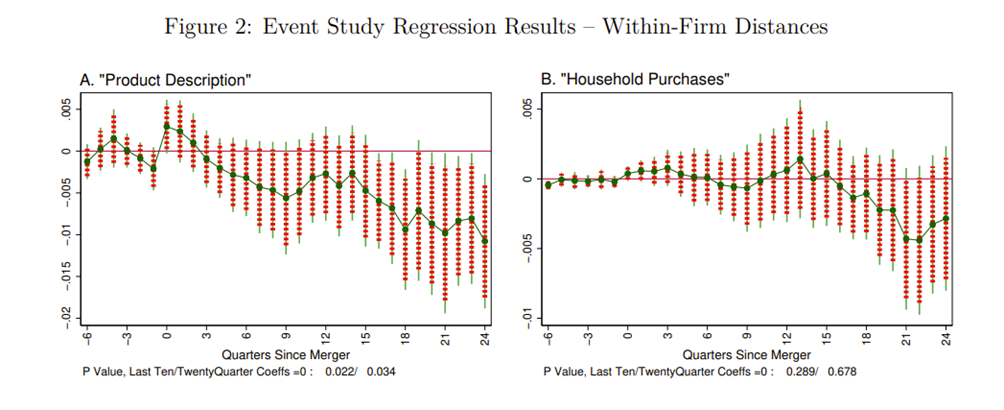
To distinguish between these two hypotheses, we explore how the overall variety of products offered by the merging firm changes. We first measure a firm’s product variety as the average of all the pairwise distances among its products within a given product market, where distance is measured either using our product-description or household-purchase approach. We then conduct an event study analysis to see how these measures of variety evolve in the year and a half before and six years after the merger.
Figure 2 plots changes in the average pairwise distances for each firm-by-product-market pair. As in our analysis of the number of products sold, we do not find any systematic change in average product similarity in the six quarters leading up to the M&A. Instead, the average distance within merging-firm-by-product-market pair declines slowly and unevenly over the first six years after the M&A. The effects we identify are modest yet economically relevant: Panel A shows a 0.08 standard deviation reduction in product variety (as measured with the “product description” metric) 18 to 24 quarters after the M&A. Panel B of Figure 2 shows a qualitatively similar, but less precisely estimated, relationship between M&A activity and within-firm distances using the “household purchase” metric.
To unpack these results further, we consider the relative importance of newly appearing and disappearing products in explaining the overall decline in variety. To do so, we estimate two sets of logit regressions, one on the likelihood of a product being dropped within 10 quarters of a merger and one on the likelihood of a product being newly added within the same period. We estimate that merging firms tend to both drop and add products that are far from the center of their joint product portfolio. (These relationships hold both when considering the household-purchase- and the product-description-based notions of distance.) Since mergers tend to involve so many more old products exiting the market than new products entering the market, on balance, mergers lead to declining within-firm product distances.
Conclusion
After M&A, merging firms sell fewer products, with greater product similarity among the products that they do sell. Taken together, our results motivate examining post-merger product repositioning in individual merger cases. Antitrust policy closely considers the impact of M&A on welfare, and even small changes in firms’ product portfolios may have substantial implications for consumer welfare.
Author Note: Research results and conclusions expressed are those of the authors and do not necessarily reflect the views of the Federal Reserve Bank of Philadelphia, the Federal Reserve System, or the Federal Reserve Board of Governors.
The researchers’ analyses were calculated (or derived) based in part on data from Nielsen Consumer LLC and marketing databases provided through the NielsenIQ Datasets at the Kilts Center for Marketing Data Center at The University of Chicago Booth School of Business. The conclusions drawn from the NielsenIQ data are those of the researchers and do not reflect the views of NielsenIQ. NielsenIQ is not responsible for, had no role in, and was not involved in analyzing and preparing the results reported herein. This research did not receive any specific grant from funding agencies in the public, commercial, or not-for-profit sectors.
Author Note: Wanjia’s contribution to this research project was completed upon receiving his Ph.D. in 2022.
Articles represent the opinions of their writers, not necessarily those of the University of Chicago, the Booth School of Business, or its faculty.