

Researchers find that a smaller fraction of workers today earn low wages than at any point since the early 1980s.
Many Americans believe that wages of those earning the least have worsened in recent years. Former president Donald Trump blames worsening conditions on low-skill immigrants and the loss of manufacturing jobs to foreign competition from NAFTA nations and China. Senator Elizabeth Warren blames the erosion of unions and worker power and proposes policies that extend labor rights to all workers and increase the minimum wage to $15. Andrew Yang argues that “good jobs are becoming more and more scarce” due to automation, the process in which workers are replaced by robots and machines, and as a solution advocates for Universal Basic Income.
These ideas are not limited to political campaigns. There is economic evidence supporting each of these claims: import competition reduces manufacturing wages; automation polarizes the labor market and pushes low-skill workers into low paying jobs; unions raise the wages of low-skill workers; there is an active debate on the role of low-skill immigration. These statements by high-profile political figures and the supporting academic research have led to a common perception of worsening job prospects for low-wage workers in the US.
In an attempt to understand more about these trends, we set out to empirically measure trends of low wage employment in the US, fully expecting to find that a growing fraction of US workers are earning low wages. Much to our surprise, the opposite is true: since the early 1980s, there has been a steady and significant decline in the fraction of workers earning low wages.
When measuring the fraction of low-wage workers in the data, there are two main choices that we face that could impact the results. First, there isn’t a clear best way to define a cutoff for “low wages.” For our baseline results, a worker is classified as a low-wage earner if they earn a real hourly wage below $15 (constant 2019 US Dollars). There are of course alternative ways of defining a threshold for low wages, such as thresholds proportional to the poverty line and thresholds proportional to the median hourly wage. We tested these alternatives, which show either a decrease or no noticeable change in the share of workers earning low wages. There are, however, other thresholds for low wages that suggest a worsening of conditions for low-wage workers. Most notably, comparisons to the wages of top earners show low-wage earners losing ground. However, these comparisons to top earners don’t identify the worsening of conditions specific to low-wage workers: when compared to top earners, all other workers are losing ground.
Second, we need to determine who we count as a worker and how we treat individuals outside the labor force. In our analysis, we focus on all workers between the ages of 18 and 64. We have explored many other possibilities, including, for example: excluding part-time workers and the self-employed, excluding students, and focusing exclusively on men. We exclude individuals outside the labor force (e.g. the disabled and students). When we looked at alternative constructions that would help account for these groups, our results were largely the same.
To measure the number of low-wage workers, we use data from the Current Population Survey (CPS) over the period 1979–2019. The CPS is a monthly household survey jointly sponsored by the U.S. Census Bureau and the U.S. Bureau of Labor Statistics that measures labor force participation and employment. The Outgoing Rotation Groups (ORG) segment of the data explicitly reports an hourly rate of pay (even for salaried employees, in which case it is the ratio of salary and number of hours worked) and is therefore ideally suited for our measurement of low-wage workers. That being said, we have repeated the analysis using the more commonly used March Supplement (ASEC) and both segments of the data show the same results.

Figure 1 presents our baseline results on the monthly total number of workers between the ages 18 and 64, and the number of these workers that earn a low wage. As a reminder, a worker is classified as a low wage earner if they earn a real hourly wage below $15 (in constant 2019 US Dollars). The figure clearly shows that the rate of increase in the total number of workers greatly exceeds the rate of increase in the total number of low-wage workers. At the start of 1985, there were 36.5 million low-wage workers out of a total of 88.2 million total workers (41 percent). At the end of 2019, there were 36.7 million low-wage workers out of a total of 132 million total workers (28 percent). Remarkably, there has been little to no increase in the number of low-wage workers since the mid-1990s despite a large increase in the total number of workers. This means that the growth in the labor force has come from growth in the number of new middle- and high-wage jobs as well as increases in the pay of many workers who had previously learned low wages.
In our research, we separately investigate several sub-populations of workers, including full-time workers, white workers, black workers, male workers, female workers, and white-male workers. Among these sub-populations, the decline in the share of low-wage earners is sharpest for women. For all of the sub-populations, the share of workers earning low wages is significantly lower today than at any point since the mid-1980s.
One way to assess the economic condition of low-wage earners that does not depend on a particular threshold for low wages is to compare wage growth at the bottom of the wage distribution to wage growth at the middle and at the top of the wage distribution. If pay for low-wage workers has worsened, then we should expect to see wage growth at the bottom of the wage distribution lagging behind.
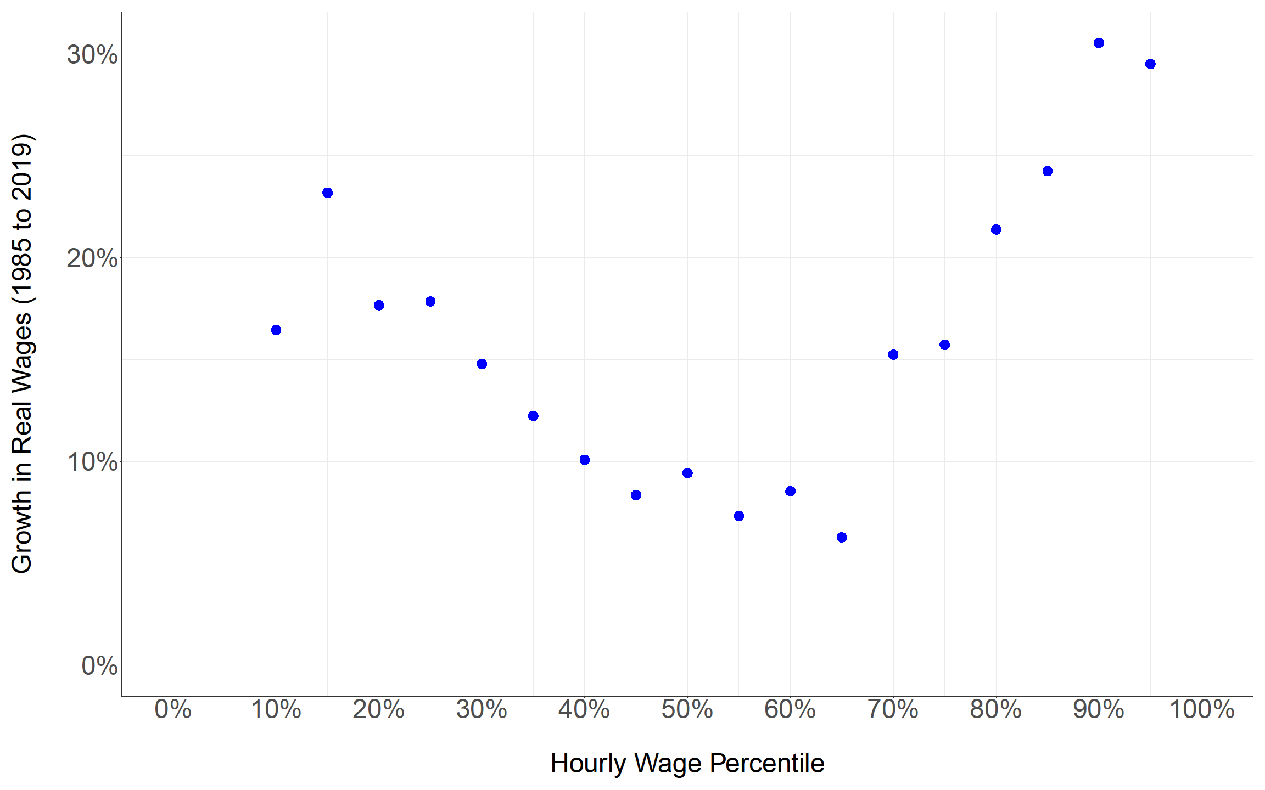
Figure 2 presents the growth of real hourly wages for US workers (ages 18 to 64) from December 1985 to December 2019 for each hourly wage percentile. Data on employment and wages are taken from the Current Population Survey (CPS) Outgoing Rotation Group (ORG). Nominal dollars are deflated using the Consumer Price Index for All Urban Consumers (CPIAUCSL). All statistics are calculated using sample weights.
Figure 2 presents evidence of polarization in the labor market that closely mimics work by Autor and Dorn (and earlier work by Katz and Murphy). Specifically, we measure the growth of real wages at each point in the earnings distribution from December 1985 to December 2019. The figure clearly shows that wages have grown much faster at the bottom of the wage distribution (the bottom third) than at the middle of the wage distribution (the middle third), and have grown fastest at the top of the wage distribution. Wages at the 30th percentile grew in line with those at the 70th percentile, and real wages below the 30th percentile grew even faster.
Even though there has been a decline in the fraction of the workers earning low wages, it is still possible that more people today are getting stuck in low-wage jobs than in the past. Perhaps in the past low-wage jobs were a temporary starting point for young workers and those re-entering the labor force, but today many more workers stay in these low-wage jobs for prolonged periods of time. Perhaps low wages have grown more persistent over time.
To address this possibility, we use data from the Panel Study of Income Dynamics (PSID) to track the same set of workers over time and measure the probability that a low-wage worker moves to a higher paying job. Conducted by the Institute for Social Research at the University of Michigan, the PSID is the longest running longitudinal household survey in the world, and these data are used extensively by researchers studying trends in demographics, wages, and other household characteristics. The design of the survey and limitations on our ability to merge the different survey datasets make it much easier to consistently track men than women. For this reason, when analyzing the persistence of low wages, we restrict our analysis to men.
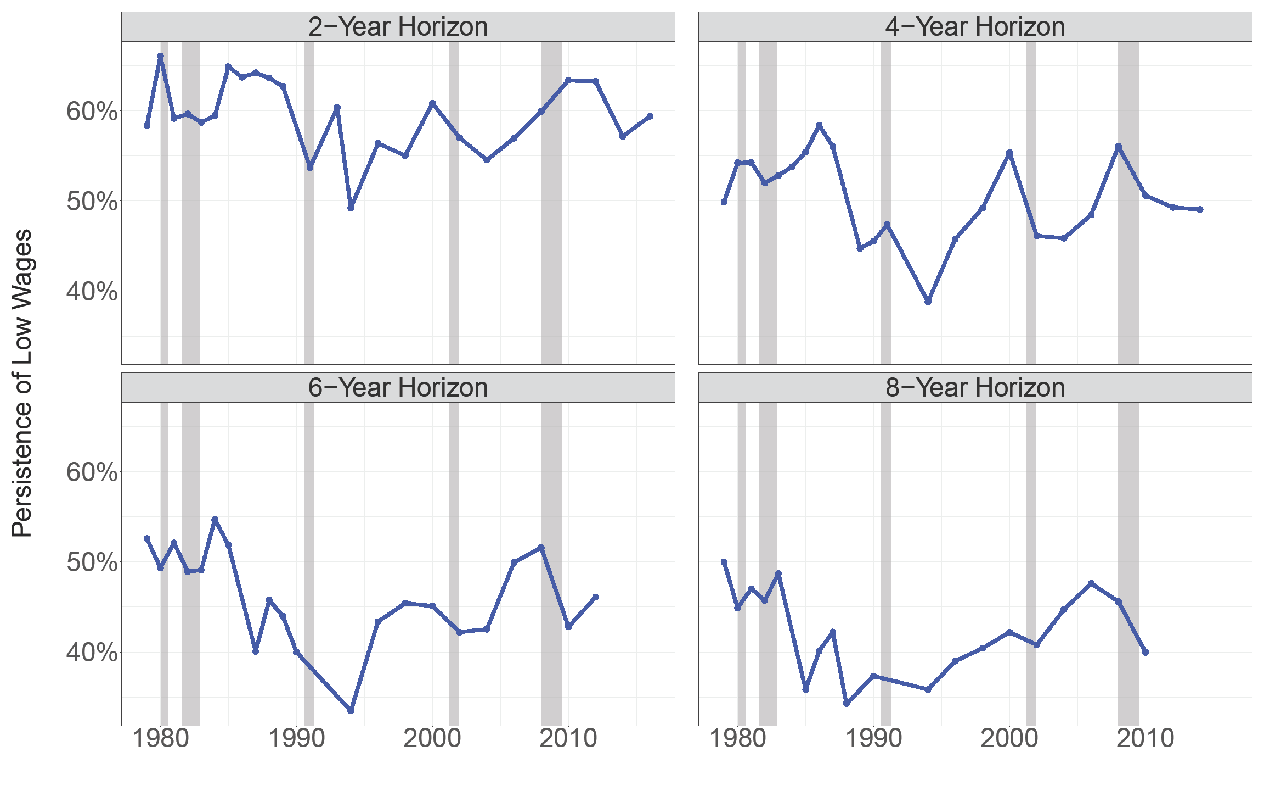
Figure 3 presents the persistence of low wages for US male workers (ages 18 to 54) from 1979 to 2018.
For a given time horizon H, persistence is defined as the share of low-wage workers in year T that continue to earn low wages in T+H. The four panels present results using the different time horizons H, ranging from two to eight years. Data on employment and wages are taken from the Panel Study of Income Dynamics (PSID). A worker is classified as a low-wage earner if they earn a real hourly wage below $15 (2019 US Dollars). Nominal dollars are deflated using the Consumer Price Index for All Urban Consumers (CPIAUCSL). All statistics are calculated using sample weights.
Our results on the persistence of low wages are presented in Figure 3. The four panels present results using the different time horizons ranging from two years to eight years. For example, the first observation in the top-left panel shows that among the workers earning low wages in 1979, 58% continued to earn low wages two years later in 1981. Similarly, the first observation in the bottom-left panel shows that among the workers earning low wages in 1979, 52% continued to earn low wages six years later in 1985. Not surprisingly, the figure shows that the level of persistence tends to be lower at longer time horizons. More importantly, the figure clearly shows that the persistence of low wages has not increased, and has likely decreased, over time.
To summarize, we show that since the early 1980s there has been a significant decline in the share of workers earning low wages. This holds across several sub-populations and across thresholds for determining low wages. We further show that the worker-level persistence of low wages has not increased, and has likely decreased, over time.
Returning to where we started, there is a popular narrative stating that “work no longer pays” and for this reason policies are needed to improve the economic conditions of low-wage workers. We are not arguing for or against any particular economic policy. Indeed, there are today, as there were in the past, economic and political grounds for a range of policies designed to help low-wage workers. For example, a recent body of research finds that economic distortions in the form of firm market power have reduced the wage growth of workers and in response some policy makers have called for increased antitrust enforcement as a way of promoting wage growth. That being said, our results clearly show that low wages are no more common and no more persistent than in the past and therefore proposed policies should not be justified on the grounds that wages of those earning the least have worsened in recent years.
Read about our disclosure policy here.