

In the past decades, the US stock market and business profits have been growing much faster than the rest of the economy. A new paper finds that these developments are part of an unprecedented global expansion that started in the 1980s and saw advanced-economy stock market capitalization tripled, reaching its highest levels in 145 years.
Over recent decades, stock markets and corporate profits have soared while economic growth has been modest. These stylized facts have generated much media interest and academic debate on their implications and drivers. Without long-run data, however, we simply do not know whether these developments are part of the latest stock market cycle, or represent a broader shift in the relationship between the stock market, the corporate sector and the macroeconomy.
In a recent research paper, we introduce new long-run cross-country data on stock market size and its determinants and use it to study the trends and drivers of long-run stock market growth. Our research builds on previous work by Raghuram Rajan and Luigi Zingales who studied the cross-country evolution of financial development during the 20th century. We take advantage of many new previously unused hand-collected sources to construct a database of stock market capitalization, equity issuance, stock prices, dividends, and corporate profits in 17 advanced economies for years 1870 to 2016. The breadth and the rich detail of our data allow us to put the recent US developments into a cross-country historical perspective, and to pinpoint the exact sources of market capitalization growth over long time periods.
We find that the post-1980 US stock market expansion is part of a global trend that has seen stock markets grow at historically unprecedented rates across all major economies. To show this, Figure 1 plots the evolution of advanced-economy stock market capitalization over the past 145 years. The data reveal two distinct eras of stock market growth. Between 1870 and the 1980s, market capitalization varied substantially but its long-run growth rate was similar to that of real activity. Consequently, the ratio of market capitalization to Gross Domestic Product (GDP) fluctuated around a long-run level of about one-third. The 1980s and 1990s, however, marked a sharp level shift with the stock market cap to GDP ratio tripling and remaining persistently high.
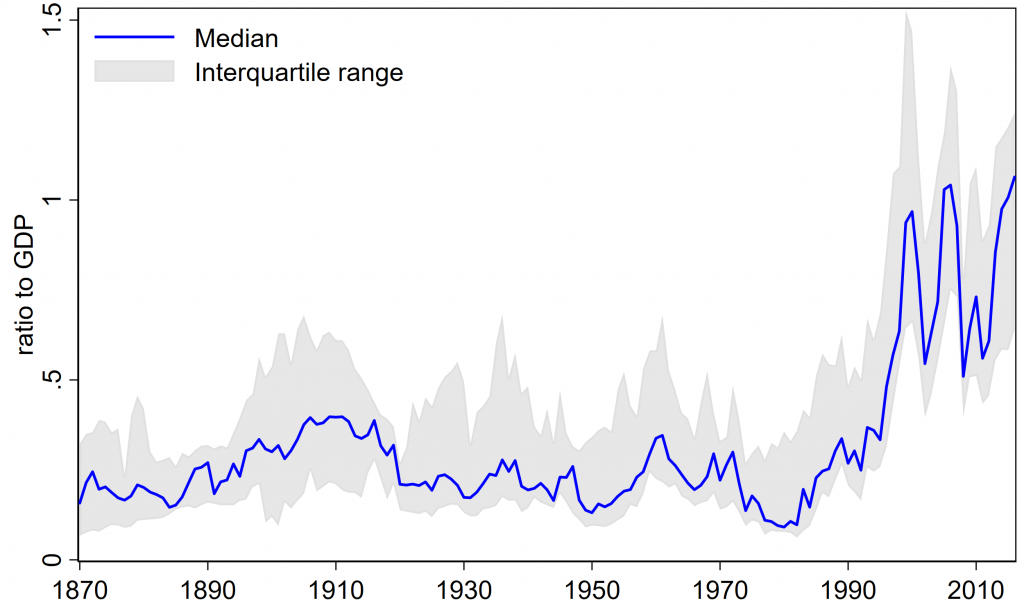
This unprecedented stock market expansion took place in every country in our sample. Across the different countries, it represented the single largest increase in stock market size during the entire 145-year sample period. The post-1980s increases in market capitalization were not only unusually large, but also unusually persistent by historical standards. As a result of this expansion, stock market wealth is now much larger relative to household income, meaning that market fluctuations should have a larger impact on people’s budgets and spending decisions.
What are the drivers of long-run stock market growth, and did the nature of this growth change after the 1980s? Capitalization can increase either because of higher stock prices, or a higher number of shares listed on the market. To see which of the two is key, we decompose market capitalization growth into two components: issuances (quantities) and real capital gains, and compare the historical pre-1985 period with the recent market expansion. Figure 2 shows that before 1985, stock market growth was almost entirely quantity-driven. In all 17 countries, the average net-of-inflation capital gains were close to zero, and large positive issuances made sure the stock market kept pace with the broader economy. The sources of this new equity have varied over time: the early 1900s saw many new companies enter the market, while the mid 20th century was a time of large secondary issues by existing firms. But despite these compositional changes, throughout these first 120 years issuances remained key.
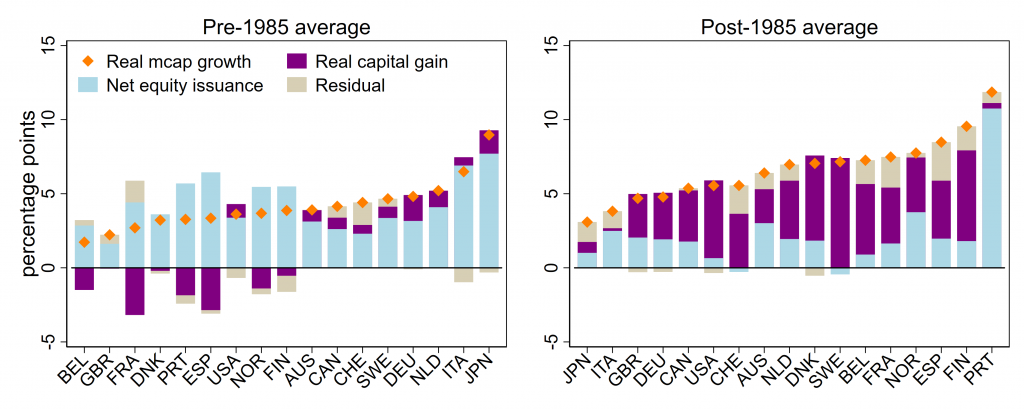
The last three decades have been remarkably different. The rapid stock market expansion actually took place during the time of slowing issuance. Consequently, the across-the-board increases in stock market size were driven by large and persistent growth in equity prices (the large Portuguese issuance being a special case as the stock market was re-established after the 1970s Carnation Revolution). Despite low issuances, these years also saw substantial market entry and exit, with new firms coming into the market and replacing old firms. This was especially true in countries where markets were previously tightly regulated, such as Sweden which placed substantial controls on new equity issuance before the 1980s. In general, the post-1980s stock price increases were broadly spread across countries, economic sectors, and new as well as old listings.
Why did stock prices increase by so much, and why did these increases—unlike much historical variation—not revert to the mean? We show that much historical variation in equity prices and market cap was driven by mean-reverting swings in the equity discount rate, a broad measure of the risk appetite of equity investors. But the post-1980s increases in market capitalization are different in that they are driven by persistent increases in the profit share of listed firms.
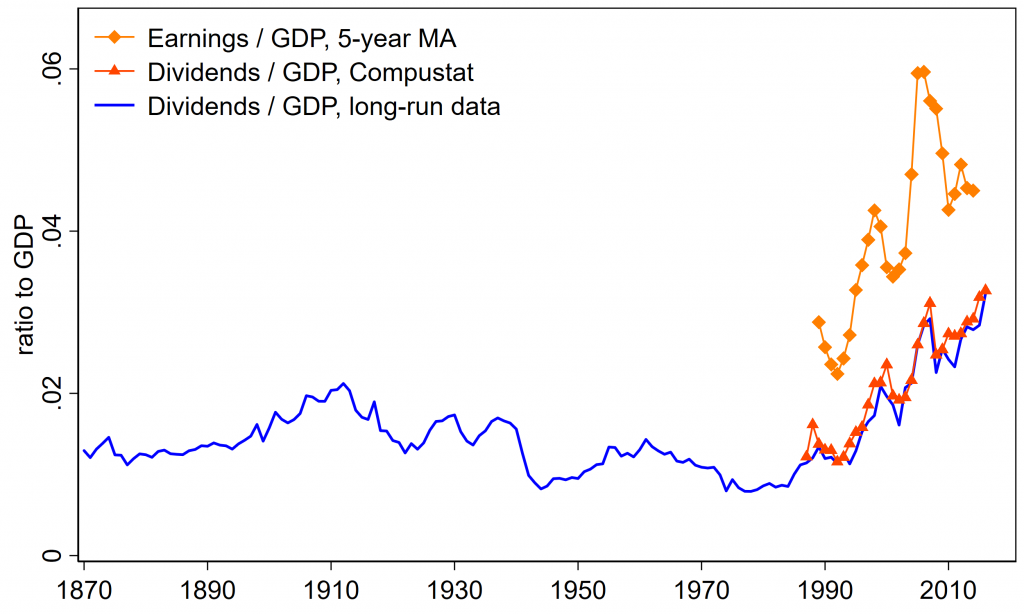
Market capitalization should equal to the sum of current and discounted future listed firm profits. This means that increases in the share of economic income going to listed firms should directly increase the ratio of market capitalization to GDP. Figure 3 plots the ratio of listed firms’ earnings and dividends to GDP in our cross-country sample. Across all the different measures, the listed firm profit share has more than doubled since 1990, reaching its highest levels in 145 years. This factor alone can account for roughly three-quarters of the post-1980s stock market rise.
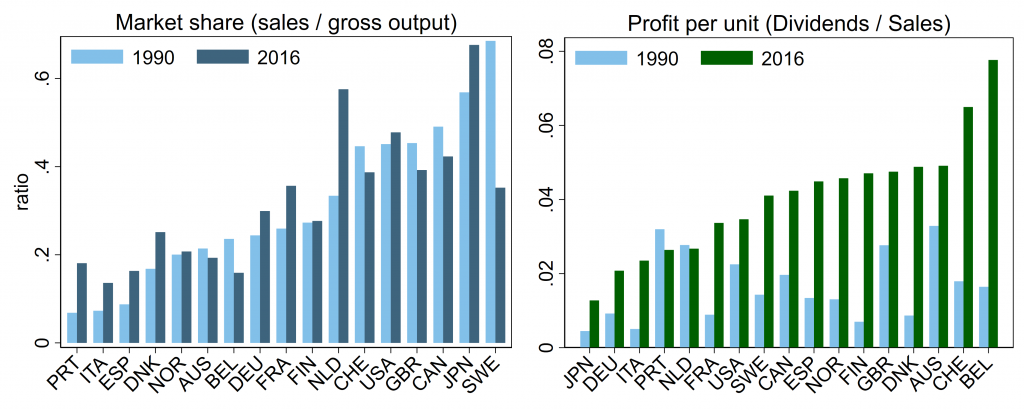
What could be driving these historically unprecedented profit increases? Profits can increase either because listed firms have higher sales, or because they earn higher margins on each sale of their products. Looking at the contribution of these two factors, we find that increases in margins are key. The left-hand panel of Figure 4 shows that listed firm market shares—the ratios of sales to gross output—did not change substantially between 1990 and 2016. Margins, on the other hand—proxied as dividends per sale in the right-hand panel—increased across our sample of advanced economies. This evidence aligns with recent work documenting rising market power and firm profitability in the US and globally.
Figure 4: Drivers of post-1980s increases in listed firm profits
What are the counterparts of this listed firm profit shift? If the listed firm profit share in GDP has increased, shares of other types of income must have fallen. We find that these increases in profits have come primarily at the expense of other types of capital income, in particular interest expenses and corporate taxes. Thus, the post-1980s falls in interest rates and taxes have indirectly contributed to the increases in corporate profits and capitalization by reducing firms’ costs, allowing businesses to increase their profit margins without raising prices or losing market share. These trends also help explain why—as pointed out in a recent paper by Chad Syverson—the recent decades have seen low growth in consumer prices coincide with increases in markups and steady or growing unit labor costs.
Our findings point to material changes in the listed corporate sector after the 1980s. These changes are global, historically unprecedented, and have seen the stock market and corporate profits grow much faster than real activity and capital income. The scope of these changes goes far beyond the well-known examples of the US tech giants, with the same patterns evident across different economic sectors and countries. The broad scope and high persistence of these transformational shifts also mean that these changes may remain with us for some time to come.
Editor’s note: An earlier version of this paper was covered in a 2020 column for VoxEu.