

A pandemic is by definition universal but while it is true that the Covid-19 outbreak has affected everyone, it has not done so equally. High-frequency data on furloughed workers in the United Kingdom show that the economic fallout of the health crisis exacerbated existing inequalities.
The coronavirus pandemic is undoubtedly one of the most severe systemic shocks in contemporary history. Beyond the tragic human toll of the virus there is another potential casualty: the economy. The Covid-19 recession is likely to go on record as the most severe downturn since World War II. But while the pandemic has affected everyone, it has not done so equally. The first data at our disposal suggest that the crisis might have exacerbated pre-existing inequalities, since poor and unequal areas proved to be especially vulnerable to the consequences of non-pharmacological interventions (NPIs), such as school and business closures and shelter-in-place orders, that brought most activities to a near-standstill.
A growing number of academic papers are now exploring the economic implications of the pandemic. Using high-frequency indicators, some economists have shown that European countries and US states that experienced larger outbreaks during the first wave also suffered larger economic losses. They attribute this result to observed changes in people’s mobility. In the same spirit, others find that countries with a stronger predicted GDP decline in 2020 have also experienced larger increases in mortality.
One of the problems that such cross-countries studies face, however, is that the economic impact of the diffusion of the virus can be mediated by different policy stances, both in terms of regulation and of support packages employed, and by different cultural inheritances that can affect the way these regulations are received by citizenry. Therefore, we look at the specific case of the United Kingdom (UK) during the second wave of the pandemic (July 2020-January 2021), which allows us to compare the economic fallout of Covid-19 across regions culturally similar and subject to a homogeneous regulatory framework.
Furloughed Workers
Our main measure of economic performances is the total number of furloughed workers. A worker furlough is a mandatory suspension from work without pay. As part of its response to the Covid-19 pandemic, the UK government has introduced the Coronavirus Job Retention Scheme in March 2020. This allows all UK employers to designate some or all employees as “furloughed workers” and to access government support to continue paying part of their salaries and protect them from permanent layoffs. The scheme has now been extended to the end of September 2021. Our data refers only to workers benefiting from this scheme, the total number of furloughed workers in the country is therefore even larger. They offer, however, an excellent measure of economic performances as the number of workers participating to the job retention scheme is very reactive to any shrinkage of economic activity.
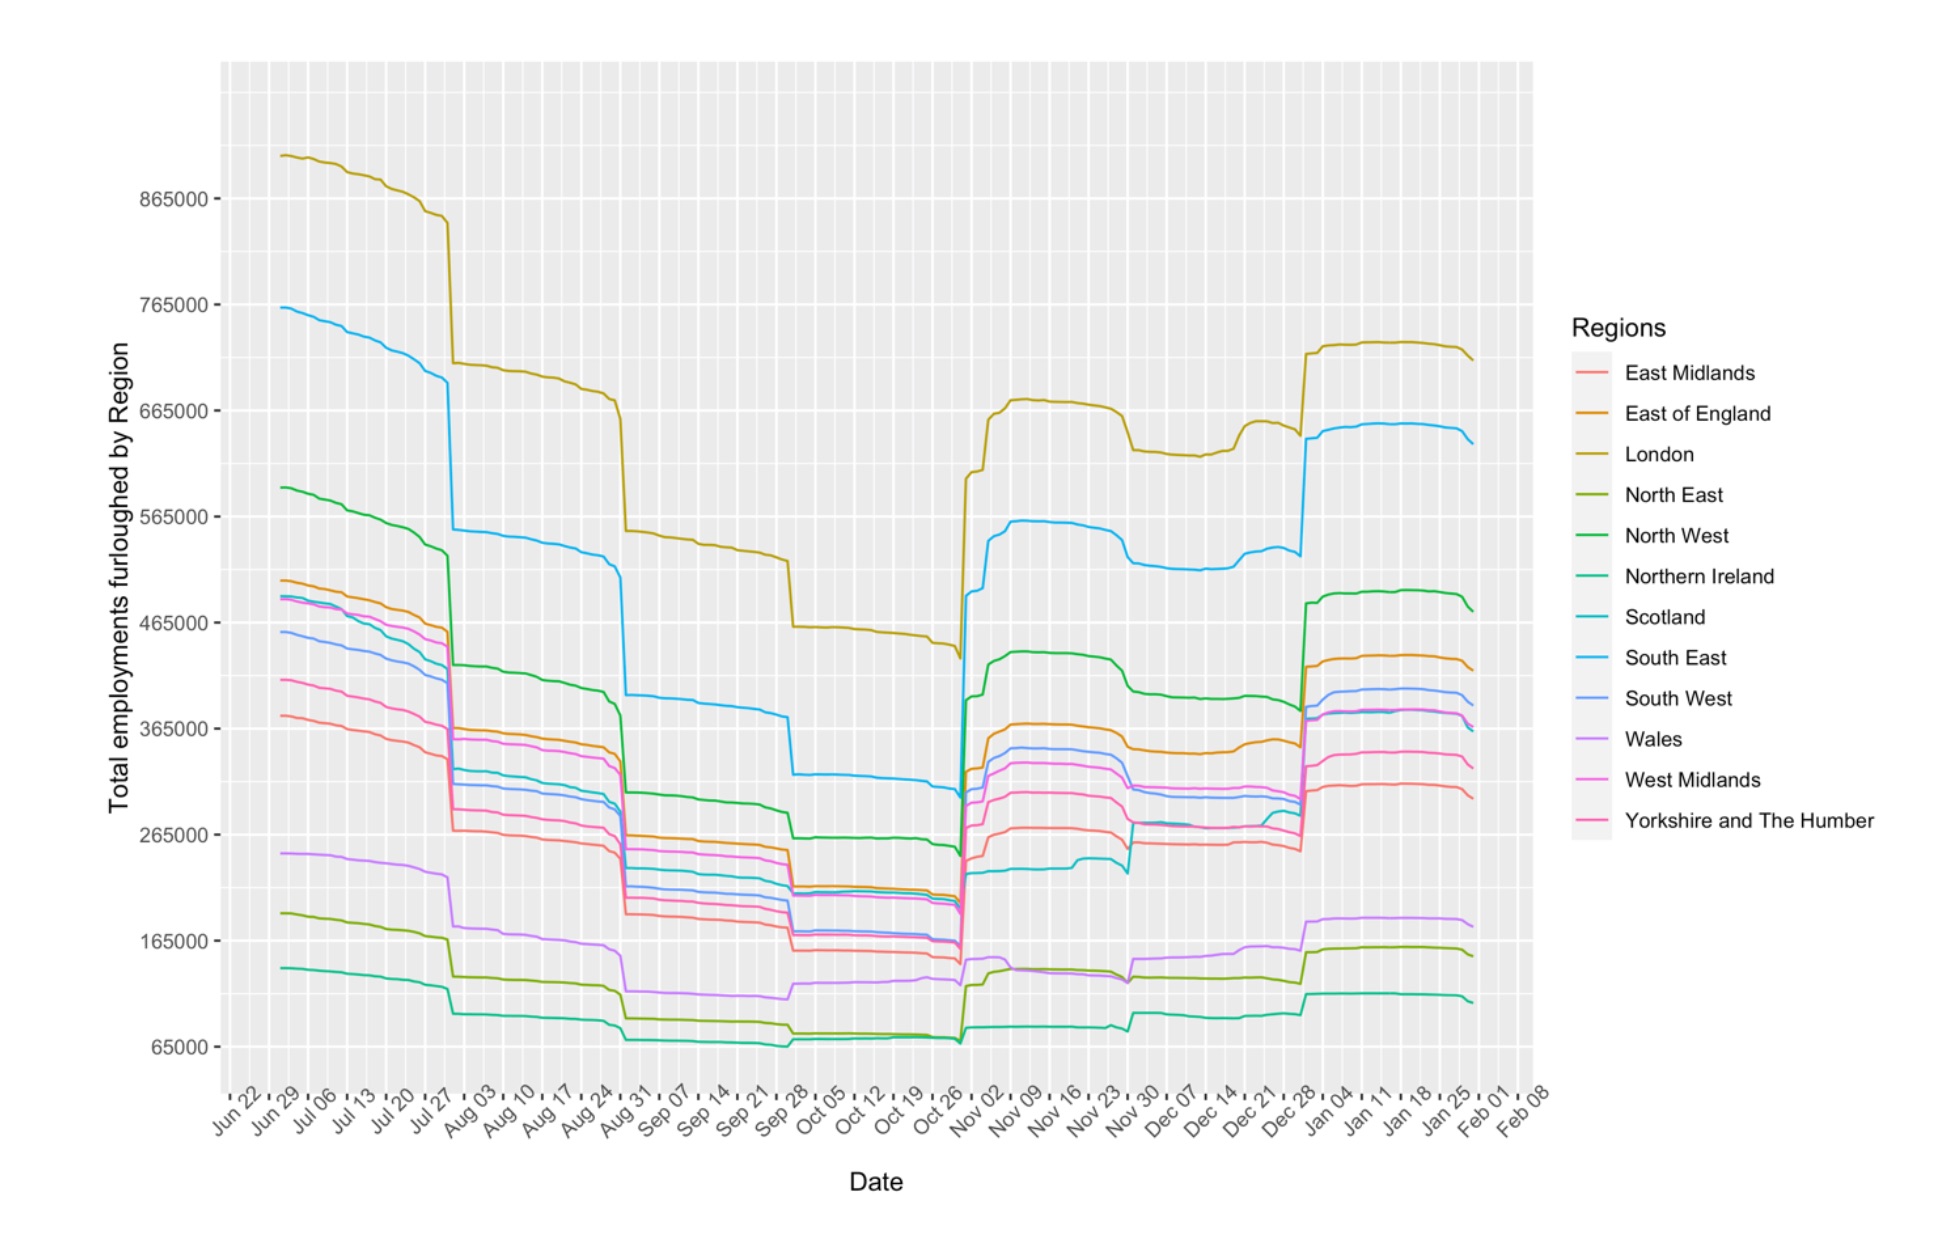
Overall, more than nine million jobs and more than one million companies in Britain have been furloughed since the launch of the government’s scheme. A first examination of the data reveals that over the sample period employments furloughed decreased until the enactment of the second national lockdown on November 1, where the series exhibits a sudden rise. They then remained fairly constant until the end of December 2020, where we record a second spike in coincidence with the introduction of the Christmas lockdown rules in the country. This highlights the potential role played by NPIs as transmission belt between the diffusion of Covid-19 and the economy (see Figure 1).
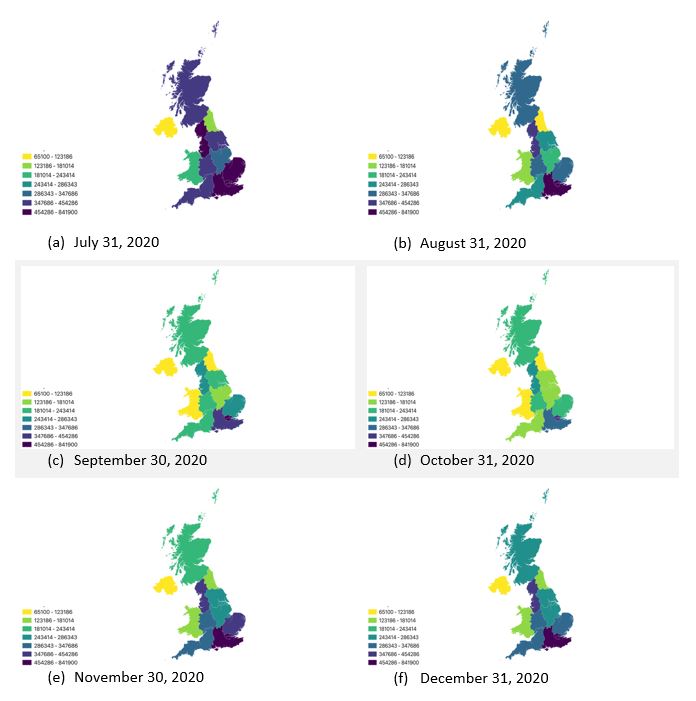
When we inspect the distribution of furloughed workers across British regions, we notice it to be quite uneven (Figure 2). London and the South East accounted for 1.19 million of the furloughed workers on December 31. Provisional estimates show this increased to 1.35 million one month later. Interestingly, while there are common elements, this map does not overlap with the evolution of coronavirus in the country (Figure 3). In particular, given the high human toll paid to the pandemic by certain regions, such as the East of England, we would have expected a much higher economic shrinkage. These less affected regions are also generally characterized by a relatively high average income level and low levels of inequality.

Equal But Different
To shed light on these discrepancies we study how, and with what lag, the diffusion of the virus across British regions, measured with new Covid-19 cases, is associated with shrinkages of the economic activity. As mentioned above, we employ the total number of workers furloughed by region as main outcome variable. This indicator is available at daily frequency, which enables us to identify abrupt changes in people’s behavior and economic activity. We identify specific regional characteristics that explain why in certain areas of the country economic costs seem to be relatively more elastic to the spread of the virus.
Not surprisingly, we find that on average the number of new cases (with one day of lag) is positively and significantly associated to the total number of workers furloughed. More importantly, we also find that that the spread of the pandemic has had particularly dire consequences on the economy in regions characterized by relatively high levels of inequality and lower income per capita, such as Wales and the North East. More equal and richer areas, as the East of England or the East Midlands, on the contrary, have shielded the crisis much better.
This is illustrated in Figure 4 below, which plots the estimated effect of Covid-19 cases on the total number of furloughed workers. An increase in the number of cases is associated to an increase of furloughed workers only in regions with an average weekly household income lower than roughly 600 pounds (panel a) and with a share of working-age population in the bottom quintile of the income distribution greater than the 16 percent (panel b), i.e., a relatively high level of inequality. In more unequal and poorer regions therefore, economic activity turned out to be much more elastic to the spread of the virus; the toll paid by these regions for each additional case has been higher than the one paid by more affluent areas of the country.

Figure 4: Average Marginal Effects. 95 percent confidence interval.
Systemic Shocks and Local Vulnerabilities
We also try to directly gauge the impact of the second lockdown on the economy. We find that the number of workers furloughed increased in each and every region as a direct consequence of the mobility restrictions, rather than of the simple spread of the disease. NPIs, in turn, seem to have acted as the main transmission belt between the pandemic and economic activity. This highlights the importance of local health conditions and policy to explain the fallout of the Covid-19 outbreak in a particular country or region.
Overall, our results suggest that even a truly systemic and universal shock, as the Covid-19 shock, is likely to have effects that vary across geographical areas depending on pre-existing conditions and specific local vulnerabilities. The risk is the perpetration (or even strengthening) of deep-rooted inequalities in the wake of the crisis. Together with the emerging evidence documenting the heterogeneous effects of the pandemic across different income groups, gender and race, our results call for policy and interventions aimed at alleviating the un-equalizing effects of the health emergency and tailored to particularly vulnerable areas and/or social categories. These include compensation and government support schemes for indigent areas or the creation of emergency financing facilities. Coming out of the crisis, and as the policy challenge will shift from containment to recovery and beyond, progress will ultimately rely on our capacity to reduce in a structural way these inequalities, through e.g. “place-based” policies favoring local development in remote locations and geographically targeted job creation programs.