
Equity markets in the EU and US dropped by as much as 30 percent, which means that investors have revised downward their estimate of future profits by as much as 30 percent. This leads to an estimate that GDP growth over the next year will be down by 2.6 percent in both the US and the EU. However, investors expect the current crisis to be shorter than the 2008 global financial meltdown.

The outbreak of the new coronavirus has caused a pandemic of respiratory disease (Covid-19) for which vaccines and targeted therapeutics for treatment are unavailable.
The outbreak has caused major concerns about public health around the world. At the same time, there are growing concerns about the economic consequences as households are required to stay home to slow the spread of the virus.
The impact that “pausing” the economy may have on supply chains, household demand, and the financial stability of the economy is largely unknown. As a result, policymakers, businesses, and market participants are revising growth expectations for the years to come.
As the current situation is unprecedented and developing rapidly, models that use macroeconomic fundamentals may miss some of the key forces and may be too slow to update, given the frequency with which macro-economic data become available.
It has long been recognized that asset prices may be particularly useful, as they reflect investors’ expectations about future payoffs. In particular, the movements in the stock market have received a lot of attention. We provide a perspective on how to interpret movements in the stock market and what it tells us about growth expectations by combining it with asset pricing data from other markets.
Equity markets in the EU and the US have dropped by as much as 30 percent. This is an extraordinary amount. To interpret this decline, it is useful to recall that the value of the stock market is equal to the sum of the discounted value of all future dividends. Hence, one could interpret this decline as though investors have revised downward their estimate of future profits by as much as 30 percent.
However, most of the variation in the value of the stock market is due to changes in expected returns, which are used to discount future cash flows, not revisions in expected future growth rates. This insight brings good and bad news.
The good news is that investors’ expectations did not decline as dramatically. The bad news, however, is that we learn little about growth expectations by studying the stock market.
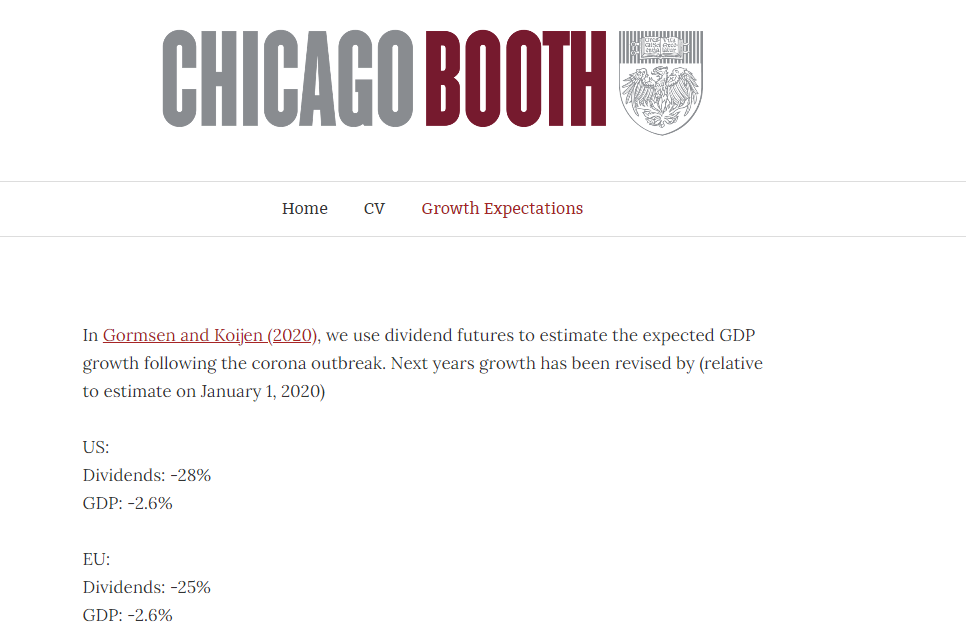
In Gormsen and Koijen (2020), we use data from a related market, namely dividend futures, to obtain estimates of growth expectations by maturity.
Dividend futures are contracts that only pay the dividends of the aggregate stock market in a given year. By no arbitrage, if we sum all dividend strip prices, they add to the market. There are two important reasons that data on dividend strip prices are informative.
First, dividend futures have historically been good forecasters of economic growth.
Second, dividend strips are differentiated by maturity, just like nominal and real bonds.
We use this feature of the data to provide an estimate of expected growth over the next year and to obtain a lower bound on the term structure of growth expectations by maturity.
Figure 1 shows the dynamics of expected dividend and GDP growth expectations in the EU and in the US until March 18. Growth expectations did not respond much to the Wuhan lockdown but deteriorated following the lockdown in Italy. The travel restrictions on visitors to the US from the EU led to a sharp deterioration in growth expectations, which once again deteriorated following the declaration of the national emergency and the subsequent actions by the Federal Reserve on March 15.
As of March 18, dividend growth over the next year is down by 28 percent in the for S&P 500 and 25 percent for the Euro Stoxx 50. The estimate of GDP growth over the next year is down by 2.6 percent in both the US and the EU.

As a word of caution, we emphasize that these estimates are based on a forecasting model estimated using historical data. In turbulent and unprecedented times, there is a risk that the historical relationship between growth and asset prices breaks down—meaning, these estimates come with uncertainty.
We also derive a lower bound on expected dividend growth by horizon, which can be computed directly using observed prices. The lower bound is forward-looking and requires neither a forecasting model nor historical data, which makes it useful in our setting, and only relies on the assumption that expected excess returns have increased.
The lower bound is plotted in Figure 2. The figure has the lower bound on the change in expected dividends on the vertical axis and the horizon on the horizontal axis.
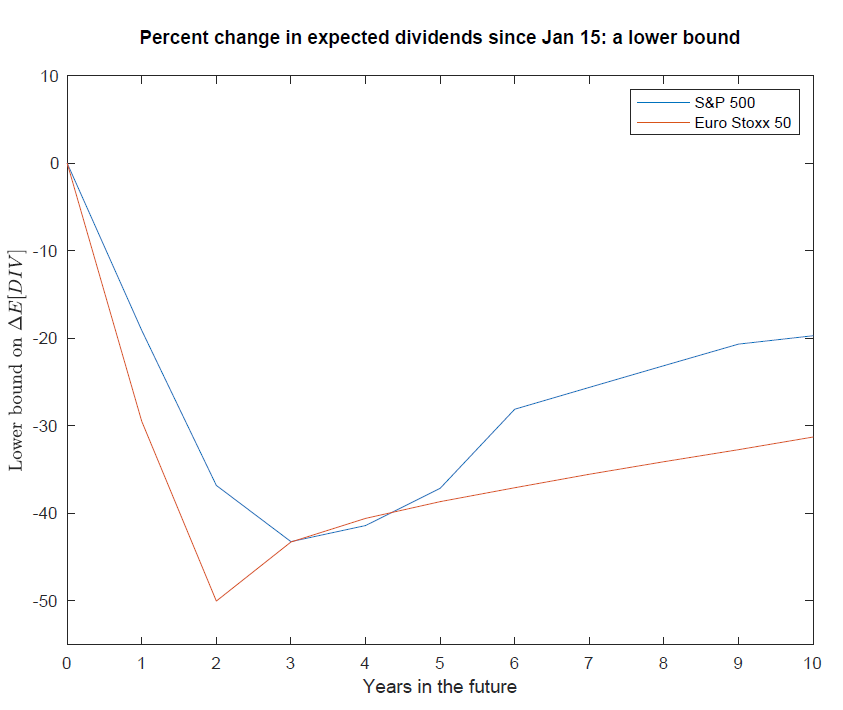
As of March 18, the lower bound is lowest on the 2-3 year horizon, where dividend growth has been revised down by as much as 43 percent in the US and 50 percent in the EU, compared to January 15. There are signs of catch-up growth longer horizons.
As of March 18, the lower bound on dividend growth is as low as what we observed during November 2008 of the global financial crisis (GFC)—at least on the short end. On the long end, the lower bound is still not as low as what we observed during the GFC, potentially indicating that investors expect the current crisis to be shorter.
As the crisis unfolds, we will update the estimates reported regularly on this website:
Niels J. Gormsen is the Neubauer Assistant Professor of Finance in 2018. His research interests include financial economics and empirical asset pricing. Ralph S.J. Koijen is a Professor of Finance at the University of Chicago Booth School of Business. He is also a Research Associate at the National Bureau of Economic Research and a Research Fellow of the Center for Economic Policy Research.
ProMarket is dedicated to discussing how competition tends to be subverted by special interests. The posts represent the opinions of their writers, not necessarily those of the University of Chicago, the Booth School of Business, or its faculty. For more information, please visit ProMarket Blog Policy.