
Supplementary Appendix on Data and Methodology to “Perverse Market Incentives Encourage High Prescription Drug Prices” by Craig Garthwaite and Fiona Scott Morton
Data
The following data were collected from Datastream on 04/21/2017: daily stock prices of the firms in the S&P 500, the daily S&P 500 price index, and the daily US 3-month treasury bill rate. The analysis was limited to prices between 04/21/2015 and 12/30/2016.
The industry categorizations used are from Datastream which place the following firms in the Pharmaceuticals and Biotechnology categories:
Pharmaceuticals: Abbott Laboratories, Abbvie, Allergan, Bristol Myers Squibb, Eli Lilly, Johnson & Johnson, Mallinckrodt, Merck & Company, Mylan, Perrigo, Pfizer, and Zoetis
Biotechnology: Alexion Pharmaceuticals, Amgen, Biogen, Celgene, Gilead Sciences, Illumina, Incyte, Regeneron Pharmaceuticals, Vertex Pharmaceuticals
Health Insurance: Anthem, Cigna and Aetna – all of which don’t have internal PBMs.
Empirical Model
The date of the presidential election was taken to be 11/09/2016 since the results were announced overnight and the stock market could only react the next morning. Similarly, since the Time magazine interview was published midday on December 7th, its date was assumed to be 12/07/2016.
The below event study was performed twice—once for each event. When running one event study, the stock prices from the day of the other event were omitted so that a “normal” return on stock is determined by the days that are not 11/09/2016 or 12/07/2016.
The event study was performed using the capital asset pricing model shown below and an event window of 1 day:
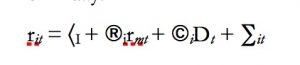
where:
rit is the stock price of firm i at time t
rmt is the S&P 500 price index at time t
Dt is a dummy variable that takes the value 1 if the event occurs at time t and equals 0 otherwise.
Interpretation
The coefficient of interest is ©I which captures the abnormal return to the stock of firm i. This can be thought of as the change in stock price that is left over after accounting for normal market fluctuations. In the above specification, this captures the change in stock price that is attributable to the release of the presidential election results on November 9th and the Time magazine interview on December 7th.
Estimates are provided below for the firms listed in Figures 1 and 2 as well as for large for-profit insurers that do not operate PBMs. It is important to note that these insurers were involved in contentious antitrust reviews of a proposed merger and therefore the election may have provided additional information about the likely continued opposition to their merger that could affect their stock price following the election.
Estimated Coefficients from the Model
Event: Presidential Election
|
Firm/Industry Name |
Abnormal Return |
Standard Error |
P value |
|
Pharmaceuticals |
0.0425 |
0.0085 |
5.704E-07 |
|
Biotechnology |
0.0661 |
0.013 |
3.5062E-07 |
|
Express Scripts Holdings |
0.0614 |
0.012 |
2.9862E-07 |
|
Health Insurance |
0.0276 |
0.0131 |
0.0347 |
Event: Time Magazine interview
|
Firm/Industry Name |
Abnormal Return |
Standard Error |
P value |
|
Pharmaceuticals |
-0.0246 |
0.0083 |
0.0032 |
|
Biotechnology |
-0.0406 |
0.0127 |
0.0014 |
|
Express Scripts Holdings |
-0.0225 |
0.0117 |
0.0535 |
|
Health Insurance |
-0.0095 |
0.013 |
0.4636 |
Disclaimer: The ProMarket blog is dedicated to discussing how competition tends to be subverted by special interests. The posts represent the opinions of their writers, not those of the University of Chicago, the Booth School of Business, or its faculty. For more information, please visit ProMarket Blog Policy.