

In new research, Kenneth Coriale, Ethan Kaplan, and Daniel Kolliner show how the Republican Party has benefited more from redistricting and gerrymandering. Their research has important implications for political power and representation in today’s era of razor-thin Congressional majorities.
In many democracies, representatives are chosen nationally based upon their party’s national vote share. In some democracies such as the United States, representatives are chosen in single member districts. A candidate wins if they receive more votes in their district than any other candidate. In countries where representatives are selected in districts, districts have to be periodically redrawn in order to balance population across districts. In the U.S., the Constitution grants the rights to draw districts to politicians. Does that lead to political parties in the U.S. using redistricting power to their party’s electoral advantage? What happens when political parties control the redistricting process?
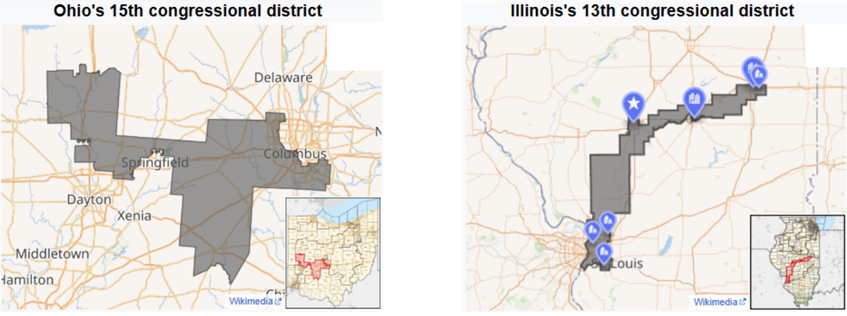
During redistricting, which typically occurs every ten years, a single political party can sometimes strategically draw boundaries within a state to disproportionately maximize the number of seats their party will likely win, a practice known as gerrymandering. The process is typically tied to the decennial census, but states have also undertaken mid-decade redistricting, most commonly in response to court orders requiring a new map, but more recently to secure additional partisan advantage. In a 2010 op-ed describing the Republican Party’s REDMAP (Redistricting Majority Project) strategy, political consultant Karl Rove wrote, “He who controls redistricting can control Congress.” The democratic consequences of such control are significant, raising questions about how gerrymandering influences political representation and governance.
To understand why partisan control of redistricting matters, it helps to consider the incentives that redistricting agents face. A political party given sole authority to draw maps (as a consequence of being in power) is likely to prioritize its own electoral advantage, thereby maximizing the number of seats it can win at both the state and federal levels. To achieve this, parties typically employ two tactics: packing, which concentrates opposition voters into a small number of districts, and cracking, which spreads supporters across many districts to create narrow victories for the party in power. However, parties may also pursue other objectives, such as preserving incumbents or increasing minority representation. By contrast, a nonpartisan redistricting body might focus on very different objectives, like enhancing electoral competitiveness or keeping communities of interest, such as racial or language minority groups, together in the same district. Who controls the redistricting process thus determines the goals the maps are designed to achieve.
In recent decades, concerns over partisan gerrymandering have contributed to institutional reform. Between 2000 and 2020, five states adopted independent redistricting commissions to remove map-drawing from politicians’ hands, and several others made serious efforts to do the same. These changes reflect a growing belief that political control of redistricting can influence electoral outcomes. However, measuring that effect is not straightforward. In our recent NBER working paper, we examine whether a political party’s legal control over redistricting leads to meaningful gains in congressional seats. We find that before 2000, political control over redistricting did not produce large or consistent partisan effects. However, since the 2000 redistricting cycle, Republican-controlled states have shifted their congressional delegations further in their party’s favor, while Democratic-controlled states have seen effects, but only in states with larger delegations.
Background
The idea of manipulating electoral boundaries for political advantage is hardly new. The term “gerrymandering” dates back to 1812, when Massachusetts Governor Elbridge Gerry signed a redistricting bill that produced a district so contorted it was said to resemble a salamander. The term is still used today, but the practice has grown more sophisticated over time. The opportunity to redraw the maps arises once every ten years, following the decennial census, and it operates within a set of certain legal constraints. All states must adhere to the equal population requirement under the Apportionment Clause of Article I, Section 2, and comply with Section 2 of the Voting Rights Act, which prohibits redistricting that intentionally or inadvertently discriminates on the basis of race. Many states also impose additional rules, the most common being contiguity, which requires all parts of a district to be geographically connected. However, no federal standards govern partisan outcomes. In the 2019 case Rucho v. Common Cause , the U.S. Supreme Court held that claims of partisan gerrymandering are “political questions beyond the reach of federal courts,” effectively leaving states to police themselves. In some states, state courts have moved to police this question, even if federal courts will not.
Figure 1.
To estimate the impact of a political party’s legal control over redistricting, we first have to define legal control in precise terms. This is the first contribution of our research. Legal control exists when a single political party can enact a redistricting plan without needing any support from the opposing party. In most states, this occurs when the same party controls both chambers of the legislature and the governor’s office. In some cases, the rules differ. For example, in Connecticut and North Carolina, redistricting plans are passed by the legislature and are not subject to gubernatorial veto. At the same time, not all states permit this kind of control. Some are too small to have more than one district and thus there are no district boundaries to redraw. Others rely on bipartisan or independent commissions that remove the process from the control of a single political party, meaning that a party cannot have legal control in that state. We are careful to define legal control because it is central to assessing whether a state’s map could have been gerrymandered.
Measuring the Effect
One of the biggest challenges in evaluating partisan gerrymandering is measuring its true effect. We begin by identifying cases where a party had the power to gerrymander, as outlined above. However, even with this power, to what extent do legislators significantly affect the outcome of elections? A simple, though naive, starting point is to compare congressional outcomes across states based on who controlled the redistricting process. In the table below, we report the average share of House seats held by Republicans from 1972 to 2016 in three types of states: those where maps were drawn under Republican legal control, Democratic legal control, and bipartisan or nonpartisan control.
| Redistricting Control Type | Average Republican Seat Share (%) |
| Republican Legal Control | 62.6% |
| Bipartisan / Nonpartisan | 46.3% |
| Democratic Legal Control | 38.7% |
At first glance, one might conclude that Republican-controlled states send 16.3% more Republicans to Congress than those with nonpartisan or bipartisan redistricting. However, this interpretation overlooks two crucial points. First, states are more likely to elect more representatives from the party in control, regardless of how district lines are drawn. Second, “wave elections” that sweep in a party to power can affect both legal control and seat shares across all states, independent of redistricting. Identifying the causal impact of gerrymandering requires us to disentangle the effect of a party’s popularity on its representation in Congress from the impact of redistricting.
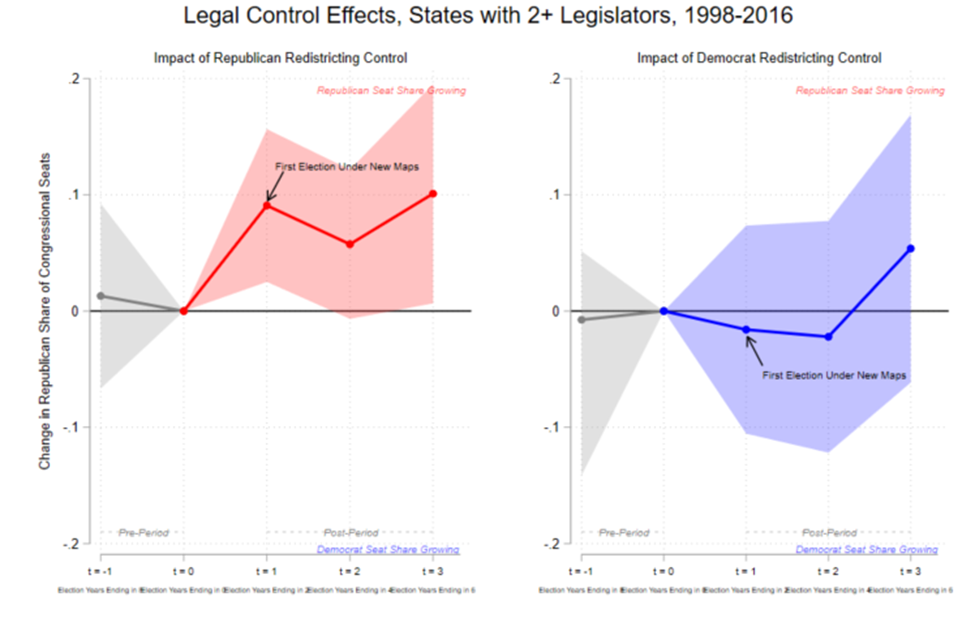
We introduce three empirical strategies, all of which point to the same core result: since the 2000 redistricting cycle, states under Republican legal control have sent more Republicans to Congress. Democratic-controlled states show a similar pattern, but only among the largest states: the 13 states with at least 10 congressional districts. These empirical strategies that we employ all compare seat share evolution in the three elections following redistricting in states where a party was able to redistrict with legal control to other states where neither party had legal control. One of our important results is that we find no evidence of partisan effects before the 2000 redistricting cycle. The difference in results starting in the 2000 redistricting cycle may be explained by a shift in gerrymandering practices, both due to explicit strategy changes and due to technological advances. In Figures 2 and 3, we show our estimates that track changes in congressional representation over time. Note that the vertical axis variable is the change in the Republican share of Congressional seats, so Republican success in gerrymandering would be a line above zero, while Democratic success would be a line below zero.
The first point to the left on each graph (time period -1) is the change in seat share before the new map. It is a placebo check where our methodology expects a zero result. These placebo estimates, shaded in gray, are flat and statistically indistinguishable from zero, suggesting no clear partisan trend prior to map changes. This supports the idea that the post-redistricting shifts we observe are not simply continuations of existing trends, but instead reflect the effects of new district boundaries. Where the red or blue shaded areas do not include zero, the estimates are statistically distinguishable from a null effect. In Figure 2, we see a clear increase in the Republican seat share following the introduction of new maps in states under Republican control. Relative to the elections immediately preceding redistricting, the Republican share of congressional seats rises by roughly nine percentage points, a change that is both persistent and statistically significant. However, we see no such increase in Democratically controlled states.
Figure 2.
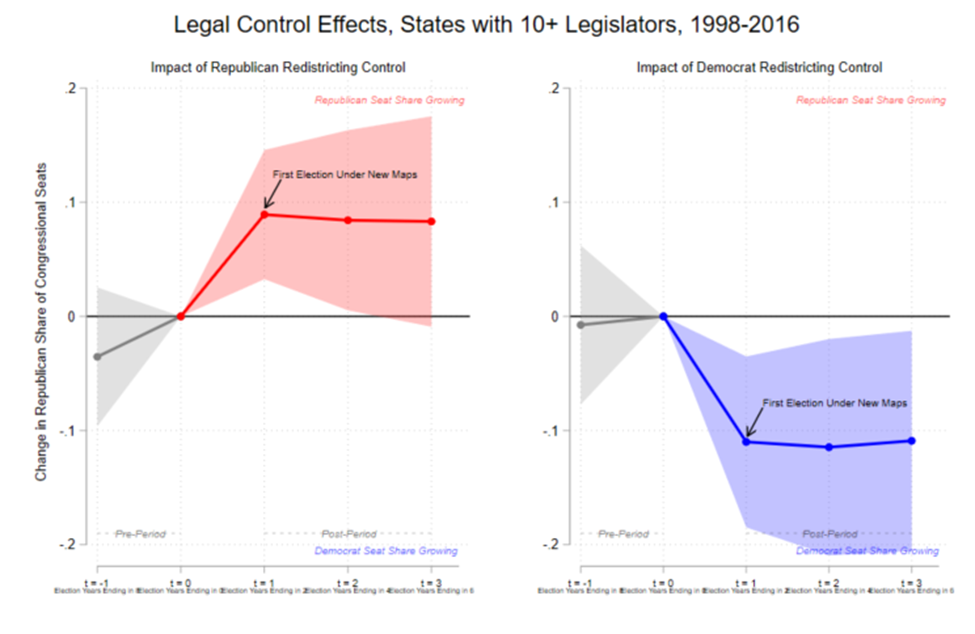
Does this mean that Democrats never use legal control to gerrymander, but Republicans do? To answer this question, we turn to a similar analysis, but restricted to large states with at least 10 congressional districts. In this subset, the effects of partisan redistricting are symmetrical across parties. When Republicans have legal control, their seat share again increases by roughly nine percentage points. But unlike in the full sample, we also observe a clear effect for Democratic control, In large states where Democrats draw the maps, the Republican seat share falls by approximately 11 percentage points.
Why then do we see an effect of legal control in Democrat-controlled large states but not in the overall comparison? There are two reasons. One, in contrast to Republicans, Democrats gain no partisan benefit from legal control in small states. Two, Republicans are more likely to have legal control in large states. The greater prevalence of large states with Republican legal control may be surprising for some readers familiar with U.S. politics. In some cases, this is a result of institutional reforms that removed politicians from the map-drawing process such as independent redistricting commissions. In others, it reflects a failure of the Democratic Party to win gubernatorial elections in Democratic-leaning states that would have allowed the party to gain legal control.
Figure 3.
Implications
Our results suggest that political control has a meaningful effect on the partisan balance of Congress. Using our estimates, we compute the aggregate impact of both Republican and Democratic legal control by decade. In the 2000s, the effects of Democratic and Republican control nearly canceled out, resulting in a net change of less than one seat. In the 2010s, however, the net effect rose to a 15-seat swing in favor of the Republican Party. This asymmetry appears to be driven by the absence of Democratic legal control in large states during this period. In short, we find that who controls the redistricting process does matter and the magnitudes are large enough to be pivotal for control over the House of Representatives in an era of razor-thin margins for majorities.
Authors’ Disclosures: The authors report no conflicts of interest. You can read our disclosure policy here.
Articles represent the opinions of their writers, not necessarily those of the University of Chicago, the Booth School of Business, or its faculty.
Subscribe here for ProMarket‘s weekly newsletter, Special Interest, to stay up to date on ProMarket‘s coverage of the political economy and other content from the Stigler Center.