


Local governments in the United States spend trillions of dollars each year delivering essential services and infrastructure, with enormous implications for our economy and quality of life. Chris Berry and Justin Marlowe examine the links between municipal governance structures and fiscal outcomes, revealing the state of municipal finances today.
Editor’s note: This piece is part of a series examining the financial conditions of local governments in the United States and the forces that shape them.
Local government is big business. According to the most recent United States Census estimates, there are 90,837 units of local government. This includes 19,491 municipalities, 16,214 townships, 3,031 counties, 12,546 independent school districts, and 39,555 special districts. In fiscal year 2021, they spent $2.3 trillion, an amount roughly equal to 10% of U.S. GDP.
These governments deliver a vast portfolio of services and public infrastructure; everything from police and fire protection, public education, water and sewer systems, golf courses, ports, professional sports facilities, cemeteries, and mosquito abatement, just to name a few.
How our local communities are governed has enormous implications for our economy and quality of life. In this article, we discuss the structure of municipal governance and the links between structure and fiscal outcomes.
Internal and External Structures of Municipal Governance
The academic literature on local government organization is vast. We focus here on two key dimensions: the internal governance models of cities and the external relations between the many different jurisdictions that share governance responsibilities in any local area.
Internal. There are two basic models of city government, the mayor-council system and the council-manager system. The mayor-council system involves an elected mayor and city council and is prevalent in large cities. The council-manager system involves an elected city council that selects and hires a professional manager to serve as the government’s executive. The council-manager system is more common in medium and small cities, and most counties and school districts operate under a council-manager style of system as well.
External. Governance of most metropolitan areas is fragmented horizontally and vertically among many jurisdictions. Horizontal fragmentation describes the many different cities and suburbs that exist within a single metropolitan area, offering citizens a range of choices over taxes and services. Vertical fragmentation describes the overlapping of local jurisdictions, such that a citizen elects, pays taxes to, and receives services from many different local governments, typically including a city, county, school district, and a range of special purpose districts.
Municipal financial health today
It’s difficult to characterize the financial health of all local governments given the tremendous variation in their underlying local economies, state policy contexts, and local political circumstances. That said, a careful look at the best available data does reveal some noteworthy trends.
Figure 1 shows the distributions of three widely cited indicators of local financial position: unrestricted general fund balance, unrestricted net position, and investment in capital assets. Unrestricted fund balance is a local government’s working capital. It represents resources available for policymakers to appropriate in the immediate future. Unrestricted net position is akin to a government’s equity position. It is the difference between a government’s long-term assets and liabilities. Capital investment reveals whether a government has consistently maintained and upgraded its infrastructure and other long-term assets. These figures are for fiscal year 2021—the last year complete data are available—and are taken on the audited financial statements of every U.S. city, county, and school district with populations greater than 30,000.

Figure 1: Key Financial Position Measures, FY21. Shows the density distributions of three core financial condition indicators for cities, counties and school districts. Unrestricted general fund balance is unrestricted general fund balance divided by total general fund expenditures. Unrestricted Net Position is unrestricted net position divided by general government revenue. Capital asset investment is the annual change in capital assets net of relative debt. Distributions are for the three-year moving average of each measure in FY21.
Figure 1 reveals two key trends. First, we can characterize most local governments’ near-term financial positions as adequate. Most maintain working capital levels between 5-25% of annual spending. Those levels are well within the ranges recommended by the main professional associations, and suggest most municipal governments are prepared for a range of near-term contingencies. But at the same time, the majority of local governments report a negative equity position, due primarily to large stocks of outstanding bonds, unfunded pension obligations, and other long-term liabilities. In Figure 1 we also see a negative trend in the infrastructure condition for roughly one third of local governments. In short, the near-term financial outlook is encouraging, but the long-term financial outlook is questionable, at best.
Governance and Financial Performance
One of the central questions in municipal governance is whether different governance structures produce different fiscal outcomes.
The evidence is mixed on whether council-manager governments operate more efficiently than mayor-council governments. At the same time, there’s persuasive evidence that council-manager governments enjoy stronger long-term financial solvency relative to mayor-council governments. Many analysts attribute this difference to professional local government managers’ tendency to focus on emerging threats to a community’s local economy rather than reacting to threats once they appear.
A closer look at the data mentioned underscores the comparative advantage of professional municipal governments. Figure 2 distinguishes “Weak Condition” municipalities—i.e. those in the bottom quintile of each of the three previously-mentioned financial indicators—from “Strong Condition’ municipalities in the top quintile for all three. Here we see a clear pattern. Nine of the ten large city weak performers and eight of the 13 small city weak performers are mayor-council governments. By contrast, all six of the large city strong performers and 23 of the 25 small city strong performers are council-manager governments.

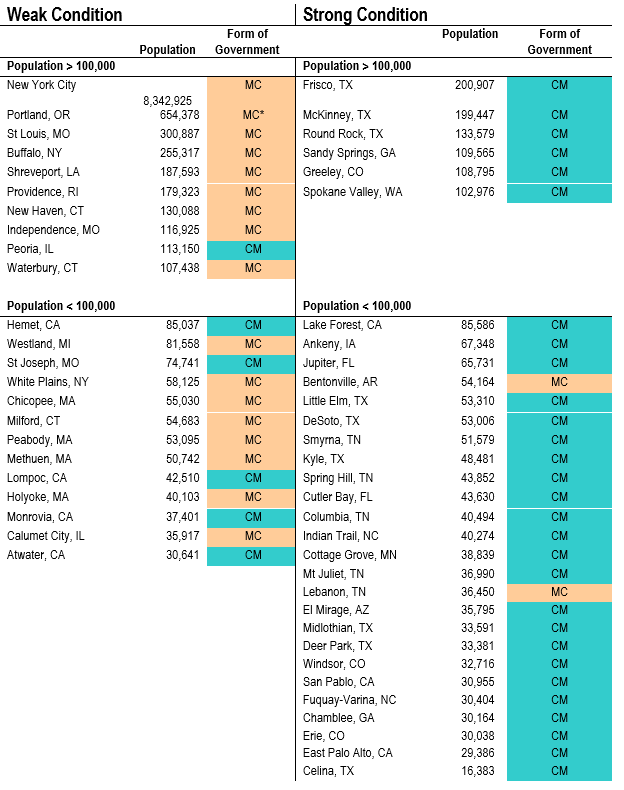
Figure 2: Financial Performance of City Governments. “Strong Condition” are cities in the top quintile for each of three financial condition indicators – unrestricted general fund balance, unrestricted net position, and capital asset investment – based on the three-year moving average as of FY21. “Weak Condition” are cities in the bottom quintile of all three of those same indicators. CM identifies council-manager governments, and MC identifies mayor-council governments. Portland, OR is a commission form of government, but is identified here as a mayor-council form.
The post-Covid era is an unprecedented opportunity to examine the relative performance of different municipal governance structures. One particularly good real-time indicator is the municipal bond market’s sentiment toward particular jurisdictions. If investors are sanguine about a municipality’s financial and economic outlook, the price of that municipality’s bonds will increase, and vice versa.
Figure 3 illustrates those trends. It is based on data from the University of Chicago’s CMF Muni Index, a measure of municipal bond investor sentiment toward specific municipalities. Higher values mean more positive sentiment. Here we see that since the pandemic, investors are much more sanguine about council-manager municipalities, and about municipalities run by Republican and non-partisan mayors.

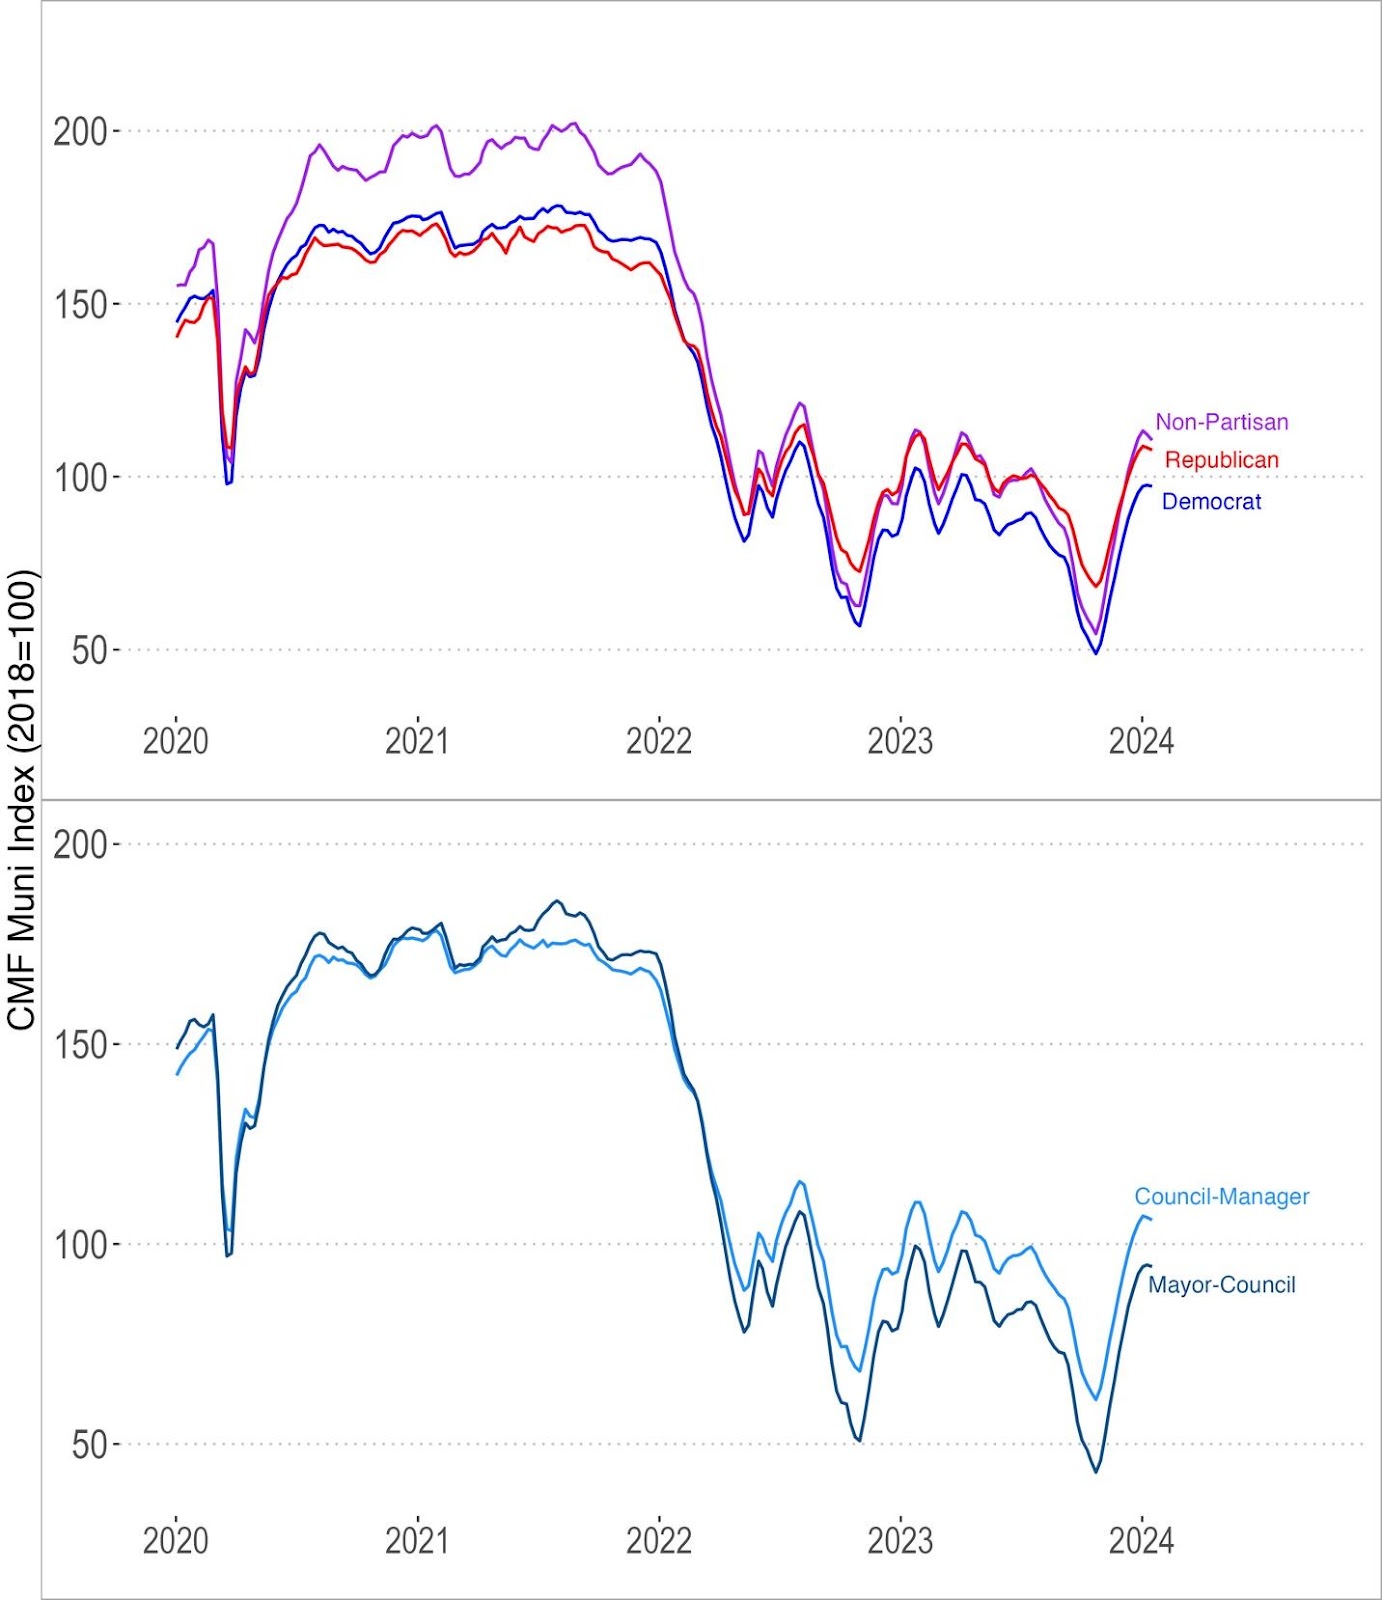
Figure 3: Municipal Governance and Investor Sentiment. Shows the daily mean CMF Muni Index for groups of cities from January 2020-January 2024. The top panel shows the daily means for cities grouped by party control of the mayor’s office. The bottom panel shows the daily means for cities grouped by form of government. The CMF Muni Index is a measure of municipal investor sentiment toward 32 of the largest US cities. It is constructed from repeat sales regressions applied to secondary market prices of those cities’ general obligation municipal bonds. For more information, see: https://munifinance.uchicago.edu/data_dashboard/
Fragmentation also seems to matter for fiscal health. For instance, in FY21, the central cities for the ten most fragmented Metropolitan Statistical Areas appear 14 times in the bottom quintile for the three fiscal health measures mentioned above. By contrast, the central cities for the ten least fragmented metropolitan statistical areas (MSAs) appear in the bottom quintile only four times.
Governing the fiscal commons
Figure 4 shows why overlapping jurisdictions matter. It shows three cities—Aurora, IL, Jackson, MS, and Modesto, CA—all with comparable populations and roughly equal per capita spending across all the overlapping governments that operate within the city limits. These “fiscally standardized” data allow us to observe where money is collected and spent across all the local governments in a particular geographic area.
In this figure we see sharp differences in the mix of revenues, spending and debt across the overlapping jurisdictions. In Aurora, IL, for instance, the local schools collect and spend the largest share of local dollars, while the city government has by far the most debt. This is in contrast to Modesto, CA, where revenues and spending are roughly the same across the city, county and schools, but special districts hold much more debt.

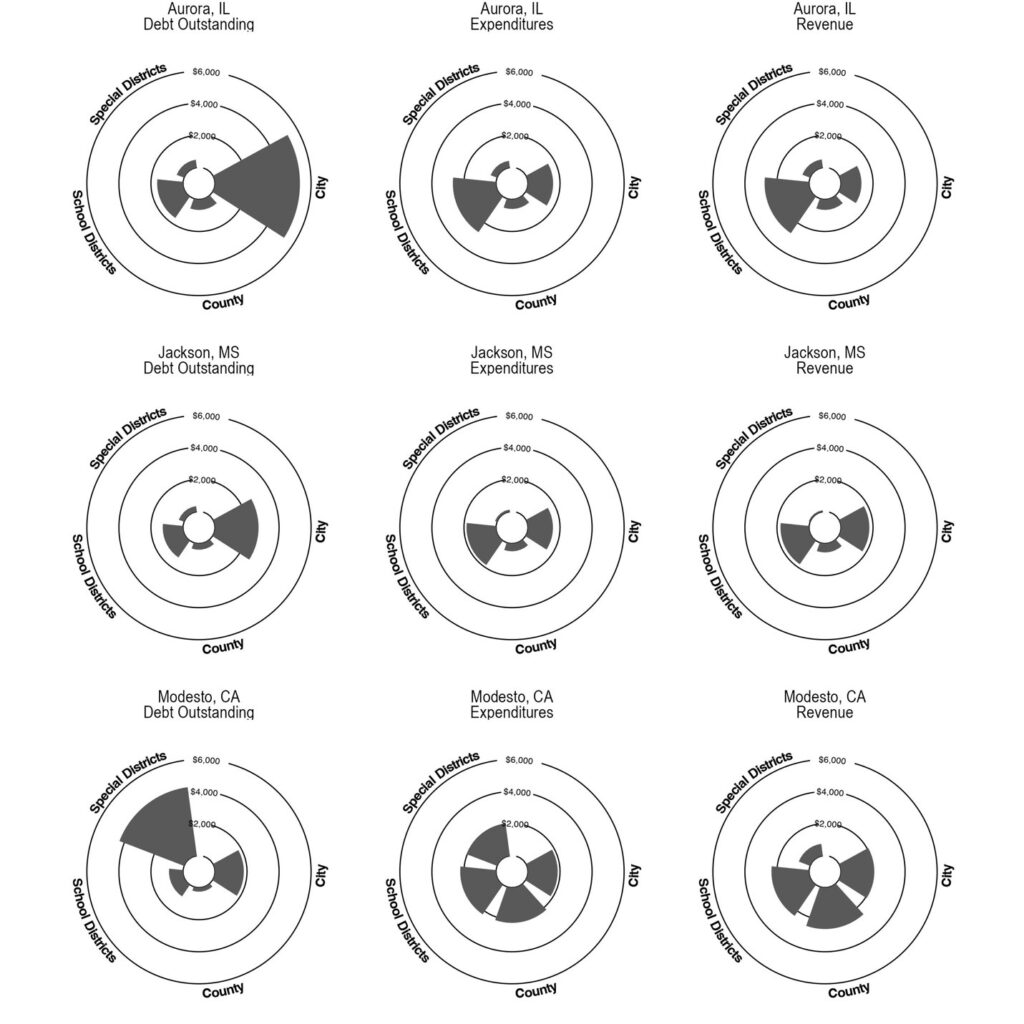
Figure 4: Overlapping Revenues, Expenditures and Debt for Three Cities. Shows the total revenues, expenditures and outstanding debt for Aurora, IL, Jackson, MS, and Modesto, CA in FY21. All figures are from the Lincoln Institute of Land Policy’s Fiscally Standardized Cities (FiSC) database. Shaded areas are dollars per capita, in real 2021 dollars, for each fiscally standardized central city and its overlapping governments.
Looking Ahead
Intergovernmental revenue exposure is a big concern going forward. Many jurisdictions emerged from the COVID-19 pandemic in a relatively strong fiscal position due in no small part to an influx of federal relief funding. As Figure 5 shows, federal aid on a per capita basis skyrocketed for cities and counties during the pandemic. Intergovernmental revenue as a percent of total revenue has increased from an average of 22.75% in 2017 to 27.35% in 2021. And even more of that money hit city finances in FY22. It’s as high as 38.4% for cities with populations greater than one million. As federal pandemic aid expires, local governments will face a reckoning.

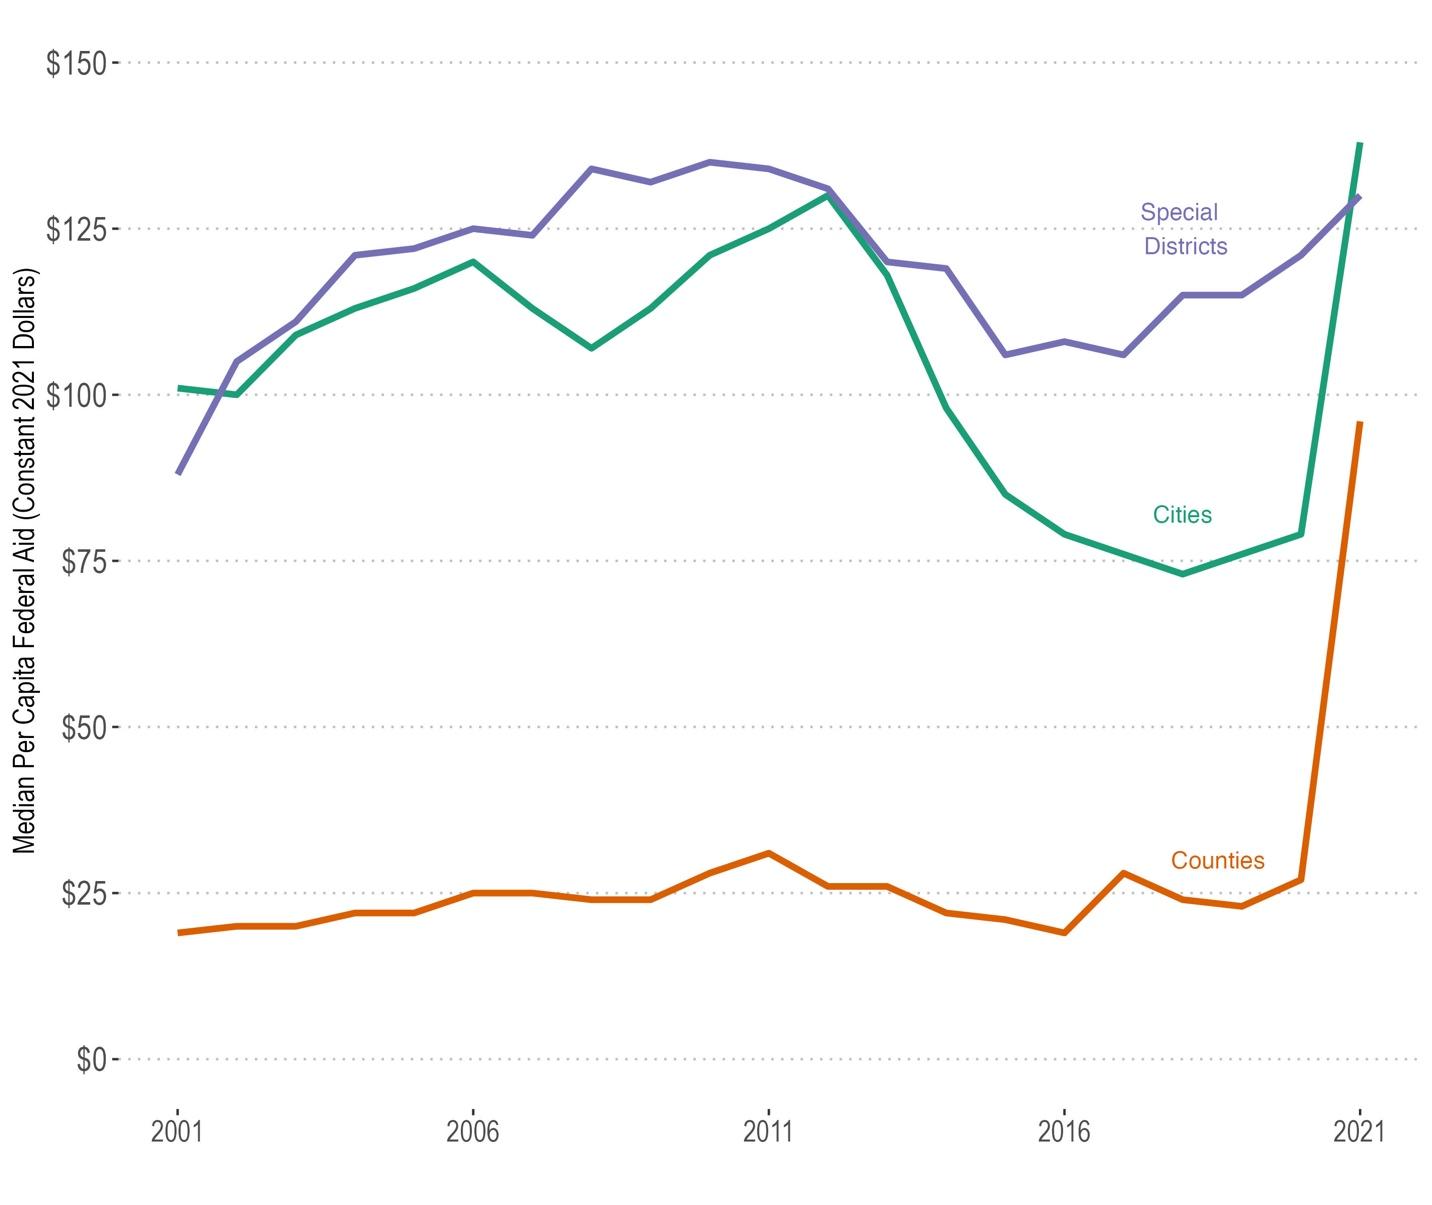
Figure 5: Federal Aid for Cities, Counties and Special Districts. Shows the median per capita federal aid for counties, cities and special districts from 2001 through 2021, expressed in constant FY21 dollars. All figures are from the Lincoln Institute of Land Policy’s Fiscally Standardized Cities (FiSC) database.
In conclusion, the structure of municipal governance in the U.S. has significant implications for the fiscal health and performance of local governments. As local governments face the expiration of federal pandemic aid, their ability to maintain financial stability will depend on the effectiveness of their governance structures and their capacity to adapt to changing economic circumstances.


