


The 2023 banking crisis that took down four banks, including Silicon Valley Bank, by all appearances appears to have been resolved by public intervention. Yet, Viral Acharya and Raghuram Rajan argue, this leaves many of the underlying weaknesses that contributed to the bank failures unaddressed. Moreover, while the authorities’ temporary fixes have stopped the panic, the system will have to absorb more unrecognized losses over time.
ProMarket is publishing a series of articles revisiting the 2023 banking crisis and the lessons learned. Read here for our original coverage in spring 2023.
It has been a year since the mini banking crisis in the United States that began in March 2023. By appearances, public interventions to prevent contagion worked, and news coverage has long moved on. But with hindsight, was the banking crisis just a storm in a teacup? Was it just an issue with a few banks or really a systemic problem? Should the Federal Reserve and Treasury intervention at that time comfort or worry us?
The backdrop
Four mid-sized U.S. banks failed around March 2023, the most prominent of which was Silicon Valley Bank (SVB), which became the second largest bank failure in U.S. history after the failure of Washington Mutual in 2008. It is convenient to think the problems at these banks were isolated. Over 90% of the deposits at SVB were uninsured, and uninsured deposits are prone to runs. Moreover, SVB had invested significant sums in long-term bonds, the market value of which fell as interest rates began to rise in 2022. When SVB sold some of these bonds to raise funds, the unrealized losses embedded in its bond portfolio started coming to light. A failed equity offering then set off the run on deposits.
The problem was, however, more systemic than a few rogue banks. When the U.S. Federal Reserve engages in quantitative easing (QE) to lower interest rates, as it did to spur economic activity during the Covid-19 pandemic and the financial crisis a decade earlier, it buys bonds from a variety of private institutions. Typically, the sellers deposit the money in their bank, and this results in a large increase in uninsured demand deposits in the banking system. Of course, the sellers may later buy other financial assets to substitute for the bonds they have sold, but this simply means the demand deposits are transferred to a new holder. So, as Figure 1 suggests, uninsured demand deposits as a fraction of overall deposits increased significantly in the system after the Fed engaged in multiple rounds of QE. More stable time deposits shrank.
Figure 1. More Uninsured Demand Deposits Over Time Following QE

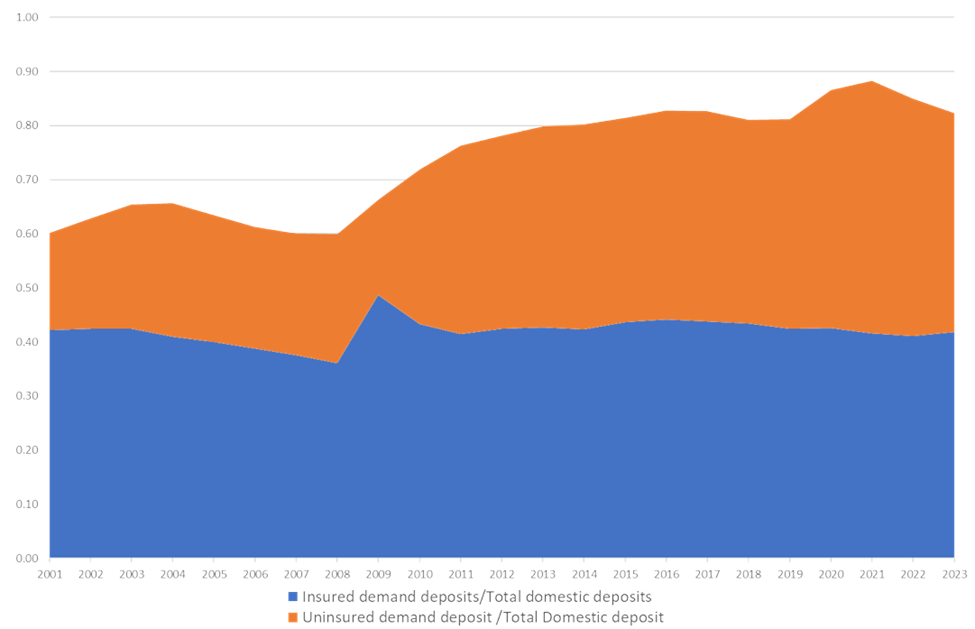
Uninsured demand deposits are likely to be withdrawn at any time in response to depositor shocks or adverse information about the bank (or both), and are therefore considered a fragile liability for the bank. However, on the bank’s asset side, there is a corresponding increase in central bank reserves which the bank can use to meet deposit withdrawals. This may seem stable, since reserves are the most liquid asset on the planet and can be used to satisfy any impatient depositors who come for their money.
Ratcheting of uninsured deposits at the smallest banks
It turns out, however, that reserves and demand deposits did not stay at the same place. In fact, smaller U.S. banks saw uninsured deposits rise dramatically relative to their holdings of reserves, by the time the Fed was done with pandemic QE. The reason was these banks extended credit or invested in securities, and the reserves typically got transferred towards the largest banks.
Figure 2. Smaller banks ratchet demand deposits up

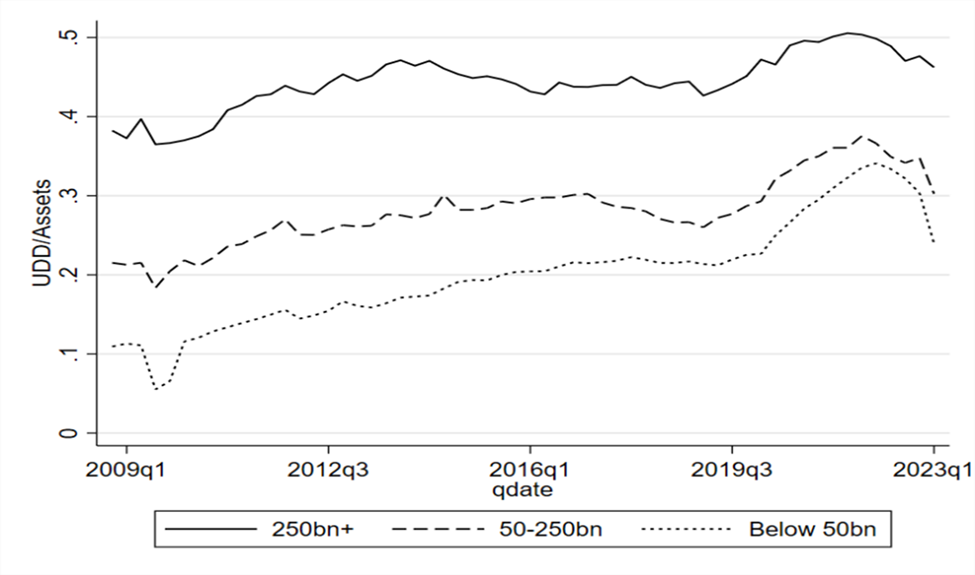
Source: Acharya, Chauhan, Rajan and Steffen (2023),“Liquidity Dependence and the Waxing and Waning of Central Bank Balance Sheets”, Working Paper, NYU Stern.
Figure 2 shows this evolution vividly by documenting the average ratio of uninsured demand deposits to book assets across U.S. banks broken down by three size partitions. The partitions are banks with assets in 2014Q3 above $250 billion, between $50 billion and $250 billion, and below $50 billion. These size partitions correspond to where the Liquidity Coverage Ratio (LCR) regulation, which requires banks to hold a certain level of highly liquid assets based on their short-term liabilities, was applied (starting in 2014): most severely, moderately, or not at all, respectively. The ratio of uninsured demand deposits to bank assets follows an upward trend from 2008Q3 to 2021Q4 for all banks: From 35.8% to 49.8% for the largest banks; 20.9% to 37.6% for mid-size banks; and 10.4% to 33.5% for the smallest banks. In other words, the largest increase in uninsured demand deposits as a proportion of balance-sheet size took place for the smallest banks, the ones not subject to the LCR regulations. While this elevated ratio for the smallest banks was much less on average than for SVB, they had drunk from the same firehose during QE.
… and a steady increase in their liquidity risk
Historically, smaller banks used to be more conservative about liquidity, in that they would offset their uninsured deposits by shoring up reserves and liquid assets such as Treasuries, agency bonds, and agency-backed securities that are eligible to be tendered at the Fed for emergency liquidity. Figure 3 shows that at the outset of QE in the end of 2008 in response to the Global Financial Crisis, banks with less than $50 billion in assets had issued fewer demandable claims, such as uninsured demand deposits, relative to their potential liquidity (holdings of reserves and other Fed-eligible assets) compared to mid-size and large banks. By early 2022, however, in aggregate, the smaller banks had issued uninsured demand deposits that were about one and a half times the size of their liquid assets. In particular, relative to potential liquidity, uninsured demand deposits fell during 2008Q3-2021Q4 from a multiple of 3 to 1.48 for the largest banks and 1.47 to 1.02 for mid-size banks. For the smallest banks, however, it rose from 0.73 to 1.47.
Figure 3. Ratcheting up Liquidity Risk

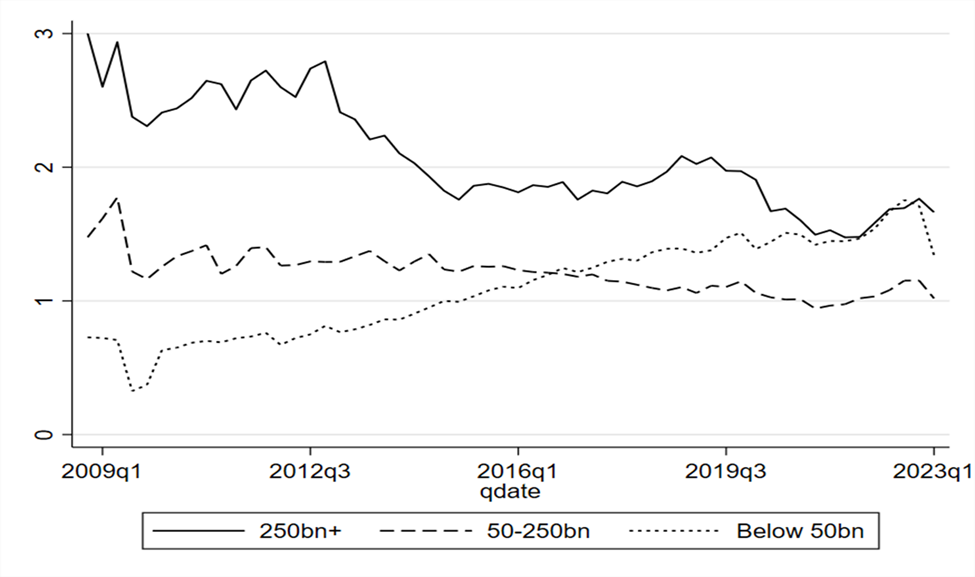
Source: Acharya, Chauhan, Rajan and Steffen (2023),“Liquidity Dependence and the Waxing and Waning of Central Bank Balance Sheets”, Working Paper, NYU Stern.
Instead of holding reserves, assets of the smallest banks were now more weighted toward long-term securities and term loans, including a significant fraction of commercial real estate (CRE) lending. The value of these assets is particularly vulnerable to interest rate hikes and an economic downturn.
Liquidity risk materialized once the Fed started raising rates and withdrawing liquidity
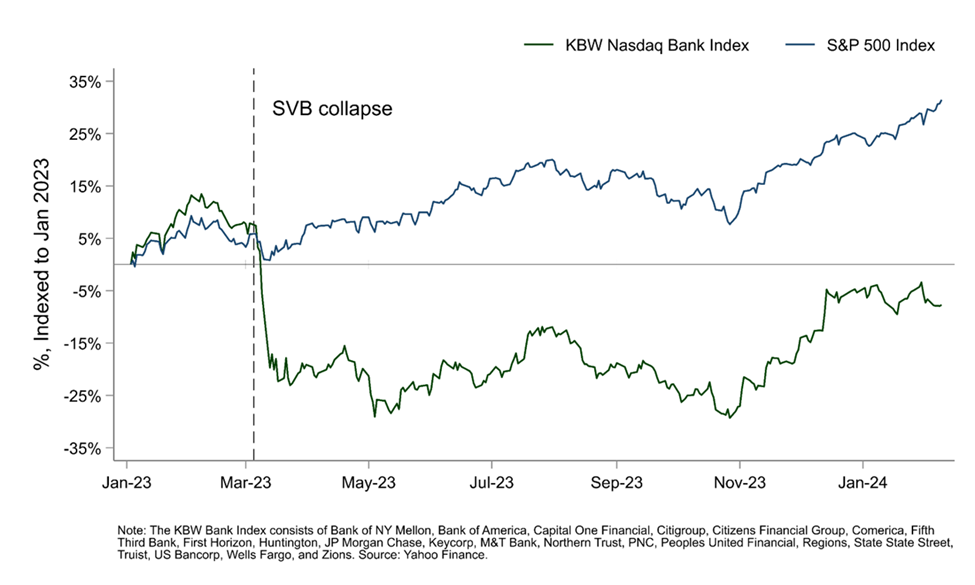
So, as the Fed raised interest rates in March 2022 and started quantitative tightening a few months later, the economic value of the assets of these banks fell sharply. Some of this fall was hidden by accounting sleight of hand, but SVB’s sudden demise caused investors to scrutinize bank balance sheets carefully. What they saw did not breed confidence. The KBW Nasdaq Bank Index, which many of these banks are part of, fell by over 25%, even as the S&P 500 rebounded robustly after SVB’s collapse (see Figure 4). Deposits started flowing out of a large number of small and some mid-sized banks. But as noted earlier, these banks did not have the liquidity to meet large sudden outflows, as most of their assets were tied to long-term securities and loans. There was a real risk of contagious bank runs in smaller banks, possibly spreading more widely.
Figure 4. Bank Stocks Since the SVB Collapse

Importantly, as private money flowed to large banks, very little flowed to small and medium sized banks. And so the Fed and Treasury had to come to the rescue.
Swift unveiling of official backstops
First, soon after SVB’s demise, the Treasury signaled that no uninsured depositor in small banks would suffer losses in any further bank collapses. Second, the Fed opened a new facility, the Bank Term Funding Program (BFTP), that lent money up to one year to banks against the par or face value of the securities they held on their balance sheet—that is, without adjusting for the erosion in the value of these securities from higher interest rates. Third, the Federal Home Loan Banks (FHLBs), effectively an arm of the U.S. government, increased their lending to stressed banks further, their total advances to the banking system having already tripled between March 2022 and March 2023 as the Fed tightened the money supply. The Treasury essentially took bank runs off the table, while the Fed and the FHLBs provided banks the funds to meet the continuing, but now not-panicking, depositor outflows.
Figure 5. Small and medium sized banks’ reliance on official backstops has surged

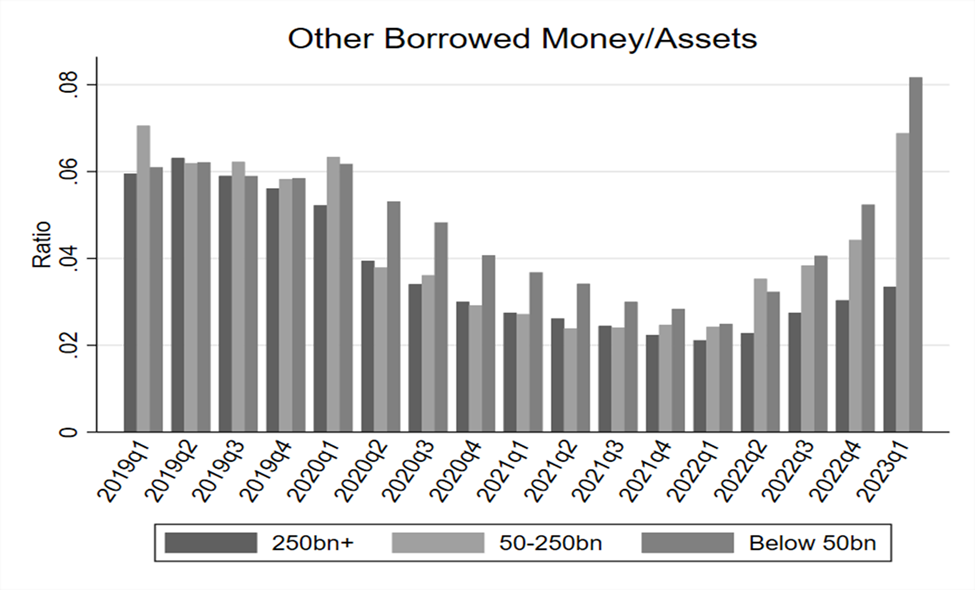
Figure 5 confirms that small and medium bank borrowing from these official sources skyrocketed. It plots as a bar chart the quarter-by-quarter values for the period 2019Q1 to 2023Q1 of FDIC Call Report fields for “Other Borrowings” (relative to assets), which include discount window borrowing from the Fed. This includes the BFTP borrowings as well as advances from the FHLBs. As seen in the figure, Other Borrowings were high following the COVID-19 outbreak in 2020, consistent with discount window borrowings from the Fed, but started declining from 2021Q1 until 2022Q1. Thereafter, they rose steadily, at first due to FHLB advances that replaced uninsured deposit outflows during Fed’s rate lift-off in 2022Q1, and then steeply in 2023Q1, following the SVB stress that induced borrowing from Fed’s BTFP discount window. These time-series patterns are most amplified for small- and medium-sized banks, which had ratcheted up balance-sheet liquidity risk and became increasingly dependent on official backstops in 2023. Large banks, in contrast, did not exhibit as much liquidity risk to start with and were able to retain access to private repo markets, thereby remaining less liquidity-dependent on official backstops.
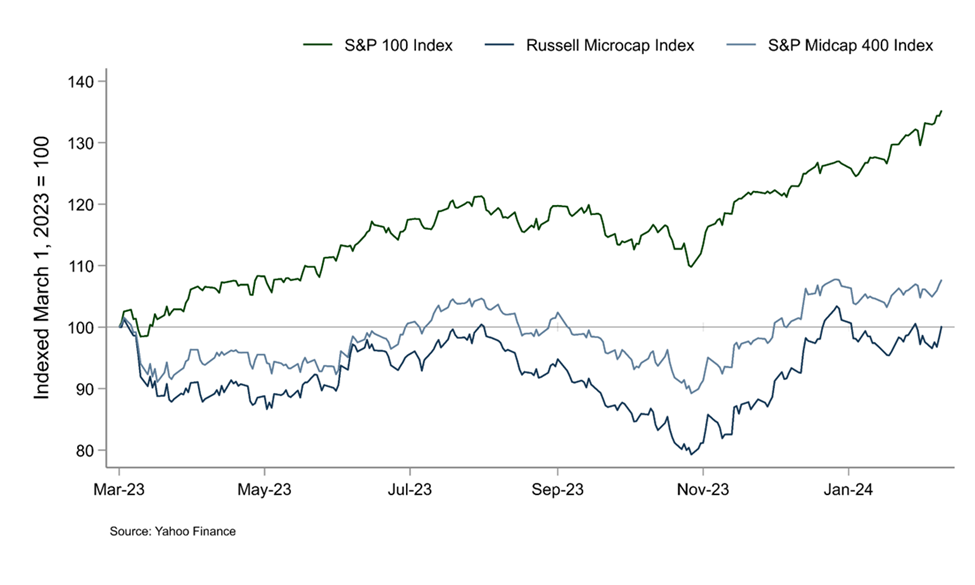
This way, a potential banking crisis was converted into a slow-burning problem for banks as deposit flight stopped and banks began to recognize and absorb the losses on their balance sheet. Recently, New York Community Bancorp, which bought parts of one of the banks that failed in 2023, reminded us that loss absorption is still underway when it announced large loan losses. The KBW Nasdaq Bank Index has diverged still more from the S&P 500 (see Figure 4). The troubled state of smaller banks has also weighed on their traditional clients: small- and medium-sized firms. As one indication, the Russell microcap index of small companies has significantly underperformed the S&P 100 index of the largest companies, and even the Mid-Cap index, since March 2023 (see Figure 6).
Figure 6. Banking crisis has negative impact on small- and medium-sized companies
In sum, matters could have been much worse if the Treasury and the Fed had not stepped in. Yet the seeming ease with which the panic was arrested has allowed public attention to move on.
From “too big to fail” to “too many to fail”?
Except for die-hard libertarians, no one seems to worry about the extent of intervention that has been needed to rescue the smaller banks, and no broad inquiry has been instituted into the circumstances that led to the vulnerabilities. As a result, several questions remain unanswered. To what extent were the seeds of the banking stress of 2023 sown by the pandemic-induced monetary stimulus and lax supervision of what banks did with the money? Did advances by the FHLBs delay capital-raising efforts of banks that failed? Are the banks that availed of official backstops after SVB’s failure keeping afloat distressed commercial real estate borrowers, merely postponing the eventual day of reckoning?
That those who knowingly took risk, including bankers and uninsured depositors, have not had to pay the price is bad for capitalism. Worse is that the authorities, in spite of sweeping banking reforms over the past fifteen years, have once again shown that they are willing to bail out players provided enough of them take the same risk. If “too big to fail” was bad, we now have “too many to fail”. We certainly cannot afford to bury the events of March 2023 in a footnote in banking history.
Articles represent the opinions of their writers, not necessarily those of the University of Chicago, the Booth School of Business, or its faculty.


