
")
And why happiness research matters for economics. An interview with Sam Peltzman.
What are the most important contributors to being happy? Does money buy happiness?
This summer, University of Chicago Booth School of Business professor emeritus Sam Peltzman produced an article that examines the level of overall happiness among adults in the United States and the demographic factors contributing to differences in happiness. Among the largest contributors to happiness, Peltzman found, were marriage and income. He also documented a small decline in happiness in recent years.
The paper generated thousands of downloads and a flurry of attention to the underlying cause of the decline in happiness.
Using survey data from the General Social Survey (GSS) going back to 1972, Peltzman looked at a number of characteristics such as race, gender, income, political ideology, geographic location, trust in government and other factors. Peltzman looked at each component’s contribution to whether people reported being happy or unhappy. He was surprised to find a 30 percentage point higher happiness score among married people over unmarried people.

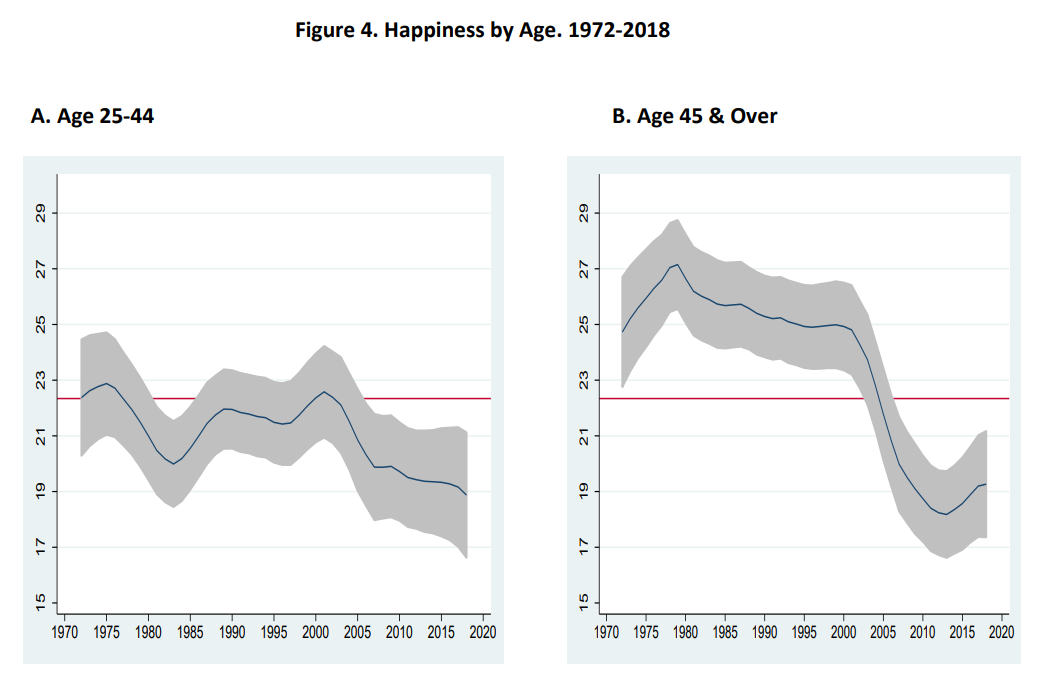
happy, 0=pretty happy, -100=not very happy. Sample mean (22.34) shown as horizontal line.
Graph shows smoothed mean and 95% confidence interval for each year
Further complicating matters, Peltzman also documents a modest, though statistically significant, four-point decline in overall happiness levels since the turn of the century. He makes it clear in the paper (and subsequent interview) that understanding the causes of this decline are beyond the scope of his paper. Nonetheless, Peltzman is inclined to believe that the decrease in happiness is somewhat, though not wholly, related to the decline in marriages given the size of the difference between the two groups.
Not surprisingly, income is also among the top factors in happiness, but here Peltzman finds evidence for the Easterlin paradox: at any point in time having higher income is associated with higher happiness. However, over time, happiness does not increase as income levels increase.
To explore this new happiness research, ProMarket Managing Editor Brooke Fox interviewed Peltzman about his paper. We have edited the interview for clarity and grammar, and on occasion added supplemental information directly from the paper.
Brooke Fox: Do you believe that the decline in happiness that you document is related to fewer people being married?
Sam Peltzman: It’s related statistically. I make it very clear in this paper that I’m not taking any strong stand on what is responsible for what. The paper shows that as an arithmetic matter, the two have gone together. But data like this can’t speak to what’s causing what.
I’m no expert on any of this. I did this because I was curious about this literature on happiness that’s been getting a lot of attention, not just from economists but from across the social science spectrum.
There are divergent views about what’s going on. One view is that it’s got to be something else causing unhappiness, because what’s really going on is that unhappiness is causing less marriage. I can’t really rule that out, but I think that the [difference between married and unmarried people’s happiness is] too big. So eventually, when it’s looked at by people who are going to devote more of their lives to it than I will, they will find that it can’t be one simple thing. You can’t have had a general social trend toward less happiness, towards less marriage, that is driven just by one or the other.
The thing that’s notable about the marriage part of this is how big the [30 point] differential is. I kind of knew there was some differential because I was familiar with some of this, but I didn’t know it was that big. I had a general idea that the population as a whole is pretty okay, but it’s only married people. It’s that big!
But we have to be careful: this has no implication for anyone’s personal situation. That’s a mistake that people make. This is a summary of a very large population, which has lots of issues and lots of personal circumstances. Anybody who gets married because of what I have written, that’s a mistake. You have to be very careful about applying it to your own situation.

happy, 0=pretty happy, -100=not very happy. Sample mean (22.34) shown as horizontal line.
Graph shows smoothed mean and 95% confidence interval for each year
Do you have any hunches as to what the underlying reason is for the differential? Is it the economic security of a marriage?
I can only give you guesses based on the size of the difference [in happiness documented between married and unmarried] and nothing more. I don’t think that it’s entirely just because happier people [are more likely to] get married, which is a view held by some people in this field. I think the difference [between the two groups] is just too big for that.
So part of it has to be [that marriage itself contributes to happiness]. That’s partly for economic reasons. One of my great colleagues in economics, Gary Becker, is famous for a paper on the economics of marriage. So it could be specialization: you do this, I do that. It’s not necessarily that you do the housework and I go out and earn a living. It’s that you can do this better, and I can do that better. Mutual support, less loneliness, this kind of thing. I think all of that has to feed into the size of this difference.
To the extent that [we’ve seen declining] long-term commitments of this kind, they have to be contributing a little bit to the decline in happiness (which, I’m going to emphasize, is not that big). At least it wasn’t before the pandemic, [after which occurred a precipitous decline that has been excluded from the paper while the long-term implications are being examined]. Since then a lot of things have gone haywire and we’re not going to know for a few years what the long-term implications of that are. But until then, the decline was relatively modest.
I have to believe that some of the decline in happiness is due to the breakdown of the norm that most people get married. Certainly for [children of unmarried people], the evidence is very clear about that and I have a hard time believing it’s unrelated to the adults. By the way, all of my data is about people over 25.
But clearly, the unhappiness among [kids] is related to being part of a nuclear family or not. I don’t say anything about that in my paper, but I’m drawing on a lot of evidence. Melissa Kearney has taken it upon herself to try to educate the part of the economics community that doesn’t know anything about this. Most academics are center-left politically, so they resist this kind of research because it’s bound up with tradition. She’s holding up a big stop sign here. I think it’s good, because it’s not something that’s new, and she’ll tell you that.
happy, 0=pretty happy, -100=not very happy. Sample mean (22.34) shown as horizontal line.
Graph shows smoothed mean and 95% confidence interval for each year
What motivated you to write this paper? Why this paper, and why now?
I’ve been retired for 18 years, so I do everything now just to satisfy my own curiosity. I had read some of this happiness stuff by economists, who are just a small part of a much bigger group that worries about this: social psychologists, psychologists, sociologists. I read some of the people who are experts and I got curious. What’s going on here?
I have the General Social Survey [GSS] on my hard drive, which I’ve been using for other things. What I do is I get curious: I look at the numbers, and then if I think there’s something interesting I’ll write it up. I don’t need to add to my CV at this point, I’m just too old for that. I’m not looking for another gig. So I did it. I thought the patterns were interesting, so I thought why don’t I write them up?
This is a quest for what’s important and what’s not important. This literature kind of goes along and it says, well, let’s look at marriage. And then another person comes along and says, what about gender? What about race? So I said, let’s look at all the standard things at once: marriage, gender, race, age, education. What’s important and what’s not important?
Two things stood out: one was marriage and the other was income. Income is how economists got into this business. Does money buy happiness? That’s a question that economists naturally gravitate towards.
There’s a very ambiguous answer to that. A paradoxical answer, it’s called the Easterlin paradox. The Easterlin paradox is, if you look at people’s level of happiness now, it’s a huge difference between being rich and being poor, but if you look at trends over time, it’s not that huge.
So if you look at people 50 years ago [when the GSS first launched], which you can do with this data, and you look at people now, the latter are generally richer. If you look at the top 20%, they’re much richer today than they were 50 years ago because there’s been a widening of inequality. But even at the top of the income ladder today they’re not happier than those who were at the top of the income ladder 50 years ago. So that’s a paradox. Today, income is a big separator. The same thing holds true across countries: if you look at a very low income, less developed country, they’re a little bit less happy than a rich country, but not much.
So that’s called the Easterlin paradox. And boy, is it true. In my data, it really is. They should give a Nobel Prize to Easterlin. He’s still around. He surfaced this paradox in the early ‘70s, so that’s 50 years ago. And nobody has really had a satisfactory explanation for it. So that’s the other thing: how stark the Easterlin paradox is.
So being at the top and the bottom of the income distribution is about as important as being married and not married, then there are other things: race and education. Then there’s also the social political aspect I got interested in. Conservatives are happier than liberals. That’s interesting. That’s interesting, and I don’t know why. People say conservatives are more religious people.
Also, people who trust the government are happier. People who trust other people are happier. And all that has gone down: trust in government has plummeted. So there’s a complex connection of forces that have sapped public trust. They’re all related, in part, to the decline in happiness.
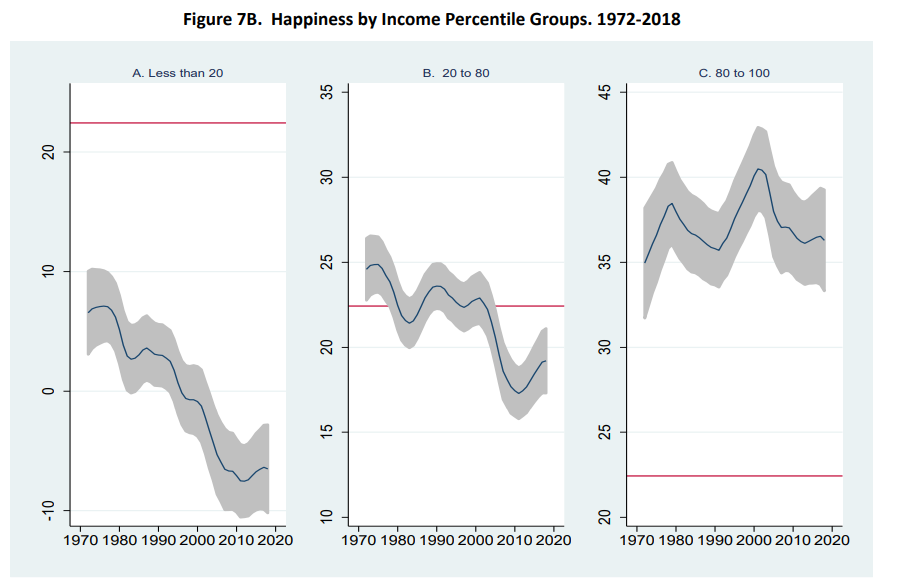
happy, 0=pretty happy, -100=not very happy. Sample mean (22.34) shown as horizontal line.
Graph shows smoothed mean and 95% confidence interval for each year
I hope you won’t laugh at my final question.
Oh, no, no.
Why is happiness important? Is it important economically? Or just for its own sake?
It’s a very good question. First of all, when you use the shorthand “happiness,” what you’re really describing is the answer to the question: are you happy? That question has been asked for 50 years in [the GSS in] exactly the same way. It’s the answer to that question, and this historical dimension, that makes it attractive: we know in surveys if you change the order of the questions or the words slightly, you can get a different answer.
If you say, no I’m not happy, you could’ve had a bad day or you could be suicidal and the survey doesn’t get at that dimension. But still, economists and other social sciences, but economists particularly, are interested in this for policy reasons. If you have a policy question, you’ll get a lot of diverse answers. At the end of the day, you have to add them up and that’s very, very hard. You need some way of adding things up, which is elusive in economics. You can’t really do it on a policy by policy basis. So economists are always searching for a summary measure.
There seems to be a fraying of the social fabric. Various indicators were going in directions that were hard [for economists] to understand. For example, [recently] there’s been a drug epidemic. There’s been a lot of worry about the decline in traditional industries in the United States and a lot of economists are saying there was this huge upsurge in imports from China that devastated a lot of local economies which created conditions for deaths of despair: people getting into drugs and overdosing on the drugs. The breakdown in marriages in these groups of people affected by these issues, it’s especially profound: lower income people and people who’ve lost jobs.
So economists are always looking for a summary measure of this, and does it map into the decline in happiness? It does to some extent. So here we are on the outside, we’re looking at all these different aspects and trying to figure out a good summary measure. Well, go ask people! Are you okay? Are you happy? Are you not happy?
There are now surveys in every country, there’s a World Happiness survey. It doesn’t go back 50 years, but it’s starting to get there. The typical polling organizations, like Gallup, now have added these kinds of questions on a routine basis. So it’s a thriving business, which is also a reason why, if your colleagues are interested and you’re a young [academic] just starting out, that’s a good thing to look at.

happy, 0=pretty happy, -100=not very happy. Sample mean (22.34) shown as horizontal line.
Graph shows smoothed mean and 95% confidence interval for each year
How do you attribute the popularity of the paper?
When I write things up now, I’m writing it in plain English. I’m a journal editor so I have enough of the academic jargon to deal with every day and I get less and less patient with it. So I write things in plain language. Anybody can understand this paper. You may need a course in statistics to know what the confidence interval is, but it’s understandable. My kids understood it, so that’s a good test. They’re not by any means economists.
Articles represent the opinions of their writers, not necessarily those of the University of Chicago, the Booth School of Business, or its faculty.