

Viral Acharya and Raghuram Rajan explain how quantitative easing contributed to the problems underlying the recent bank failures such as that of Silicon Valley Bank (SVB). They also comment on the increasingly difficult tradeoff between the Fed’s inflation-targeting mandate and financial stability.
The recent bank failures in the United States seem to have an obvious cause. Over 90% of the deposits of Silicon Valley Bank (SVB) and Signature Bank were uninsured. Uninsured deposits are understandably prone to runs. Moreover, both banks had invested significant amounts in long-term bonds. So with the rapid rise in interest rates, the value of their bond portfolios fell. When SVB sold some of these bonds to raise funds, the losses embedded in its bond portfolio started coming to light, an offering of equity failed, setting off the depositor run that led to its closure.
There are four aspects to this simple explanation that suggest the problems may be more systemic.
Quantitative Easing
First, there is typically a huge increase in uninsured bank deposits whenever the Fed engages in quantitative easing, in which the Fed buys securities from the market in exchange for its own liquid reserves (a form of cash).
That quantitative easing is associated with not just an increase in the size of the central bank balance sheet, but also an expansion in the banking system’s balance sheet and its uninsured demandable deposits is little appreciated. It is something we (with co-authors) noted in a paper presented at the Federal Reserve’s Jackson Hole conference in August 2022.
Uninsured Deposits
As the Fed resumed quantitative easing during the pandemic, uninsured bank deposits went up from about $5.5 trillion in the end of 2019 to over $8 trillion by the first quarter of 2022. Figure 1 shows that this implied a quarterly increase in uninsured deposits of over $300 billion (and close to $900 billion in the first quarter of 2020), as a result of which the share of uninsured deposits in overall deposits grew from below 48% to 53%.
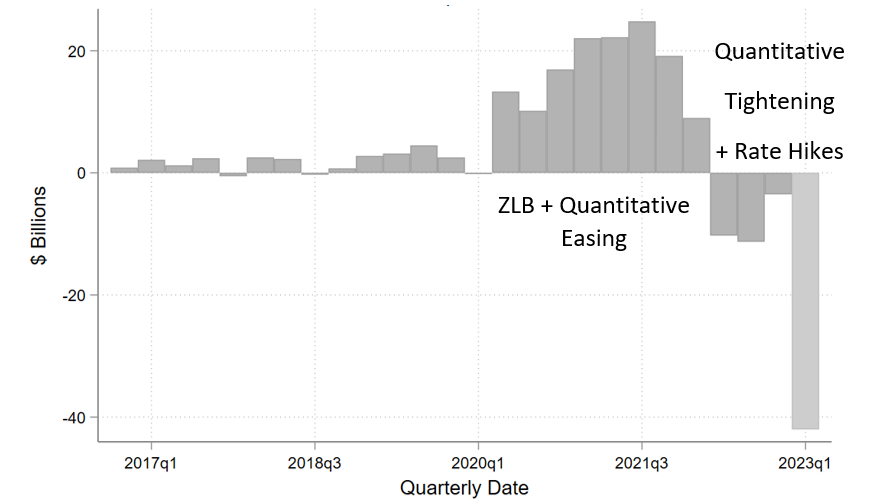
SVB’s balance sheet mirrored this aggregate phenomenon as seen in Figure 2. Deposit inflows at SVB in the third quarter of 2019 before quantitative easing were less than $5 billion, whereas they averaged $14 billion per quarter during quantitative easing. However, once quantitative easing ended and switched quickly to quantitative tightening, the flows reversed. SVB started seeing uninsured deposit outflows, no doubt some of it coincident with the downturn in the tech sector, because the bank’s stressed clients also started drawing down deposits.
Figure 1: Uninsured Deposit Growth over Pandemic QE
Figure 1 shows the growth in the ratio of uninsured deposits to total deposits of FDIC insured banks in the US between 2016Q4 and 2022Q4 on the left-y-axis. The right-y-axis shows the scale for the bar graph showing changes in total uninsured deposits in $ trillions. Data is sourced from Call Reports.
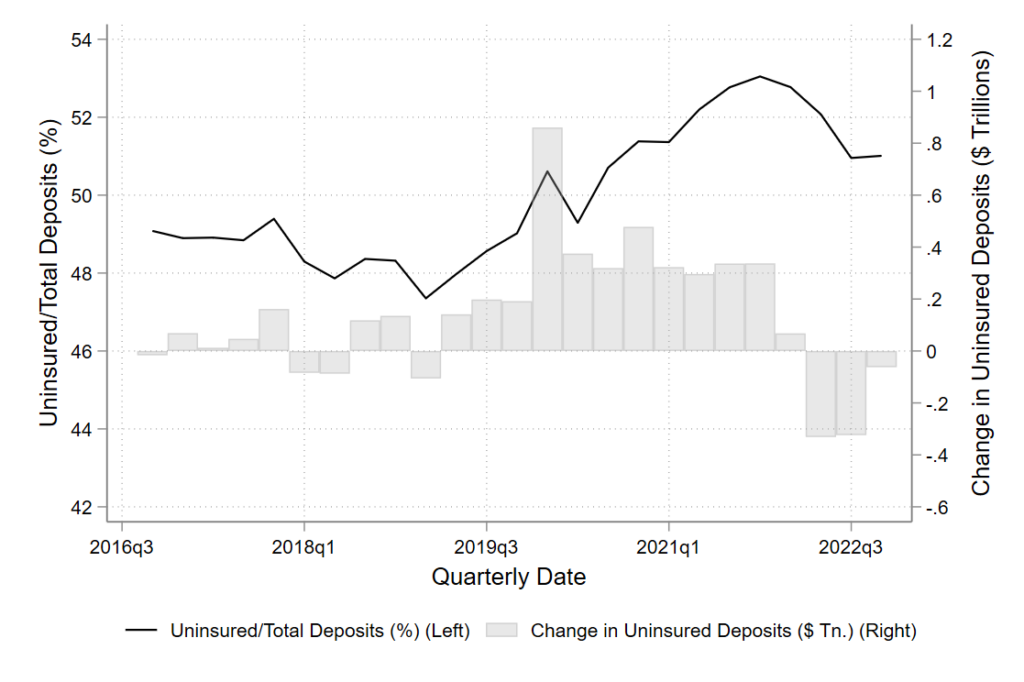
Figure 2: Silicon Valley Bank – Quarterly Change in Deposits
The figure below plots the quarterly change in deposits of Silicon Valley Bank (SVB Financial Group). All data is from Call Reports. The estimate for 2023Q1 is based on Silicon Valley Bank’s mid-quarter update.
The Road to Hell is Paved…
Second, many banks, showered with this firehose of deposits, parked them in liquid longer term securities such as Treasury bonds and mortgage backed securities so as to generate a profitable “carry” in the form of an interest rate spread. Ordinarily, this would not be risky. Long-term interest rates had not moved up much for a long time. As important, even if they did, depositors are usually sleepy and accept low deposit rates for a long time, even when market interest rates move up. Banks felt protected by history and depositor complacency. Yet this time was different, because these were flighty uninsured deposits, pushed by Fed action, and they would flow out when the Fed shifted course.
Indeed, because large depositors can coordinate more easily, the actions of a few can take more with them. Even at healthy banks, depositors, having woken up both to bank risk and the healthy interest rates available at money market funds, will want to be compensated with higher interest rates. The juicy interest rate spreads between investments and somnolent deposits that banks enjoyed in the recent past will be threatened, impairing bank profitability and solvency. As the saying in the financial sector goes, “The road to hell is paved with positive carry.”
This Time it’s Magnified
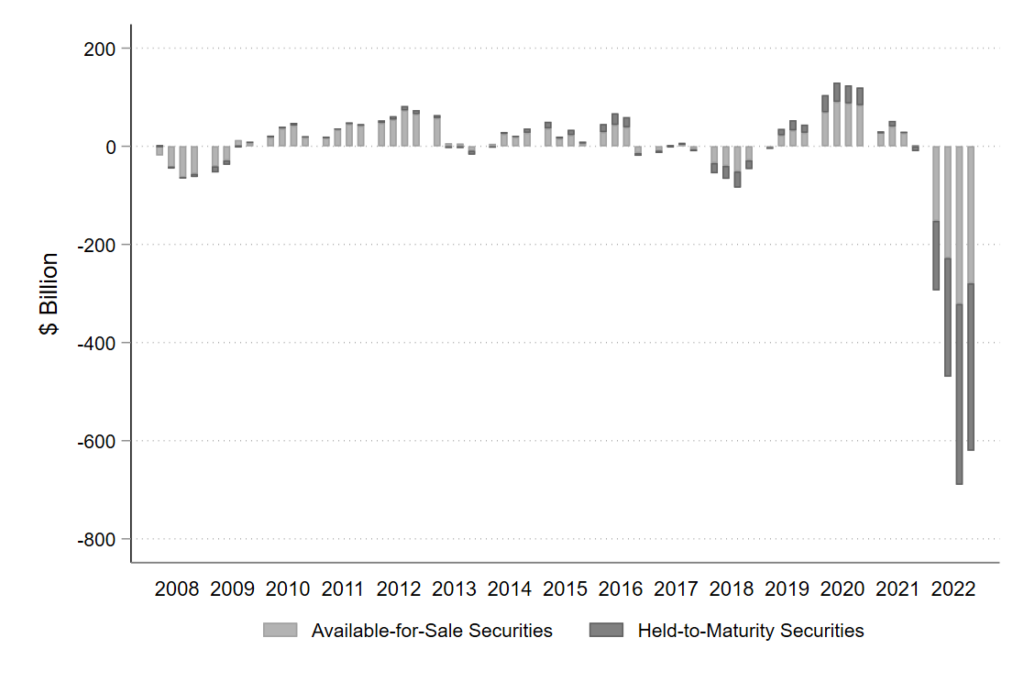
The third concern is that the first two concerns are magnified this time around. When the Fed switched to quantitative tightening and raising rates the last time round (2017-19), the rise in policy rates was less sudden and to a lower level, and the quantity of interest-sensitive securities held by banks was lower. Consequently, the losses that needed to be absorbed on bank balance sheets then were small (less than $50 billion as seen in Figure 3).
There were no depositor runs, though many of the same ingredients were in place. This time, both the quantum of rate rises, their rapidity, and bank holdings of interest-rate sensitive assets are all much larger, with the FDIC suggesting losses on available-for-sale and held-to-maturity bank securities holdings alone is over $600 billion (see Figure 3).
Supervisors
The fourth concern is unwitting supervisory coordination. Clearly, too many supervisors did not see the rising bank interest rate exposure, or were unable to force banks to reduce it. The more forceful supervision might have been (and we still are trying to gauge the extent) the fewer banks are likely to be in trouble today. But supervisors’ closer scrutiny of the largest banks, including through stress tests, without applying similar standards to all banks, may have also caused a migration of risky commercial real estate loans (think half empty office buildings post the pandemic) from larger, better capitalized banks to relatively weakly-capitalized, small and medium sized banks.
The broader point is that the vulnerabilities in the banking system are, no doubt, partly banker created. But the Federal Reserve also created some of the vulnerability. Periodic bouts of quantitative easing have expanded bank balance sheets and stuffed them with more uninsured deposits, but reversing quantitative easing is much harder because banks have become dependent on the easy liquidity. The larger the scale of quantitative easing and the longer its duration, the more time the Fed should take to normalize its balance sheet and, ideally, also interest rates.
Figure 3: Unrealized Gains on Investment Securities for Insured Institutions
Figure 3 shows the total unrealized gains (losses when negative) on investment securities either available for sale or held to maturity by FDIC insured banks in the US.. Data on unrealized gains are from FDIC’s Quarterly Banking Profile.
No Stability Mandate
Unfortunately, these financial stability concerns conflict with the Fed’s inflation-fighting mandate. Markets now expect rate cuts in a time of significantly-above-target inflation and some observers are calling to a halt to quantitative tightening even as the Fed provides liquidity in large quantities once again through the discount window and other channels.
If financial sector problems do not slow the economy, such actions could make the fight against inflation more protracted and costly. As it reexamines bank behavior and supervision in any post-mortem, the Fed cannot afford to ignore the role its own monetary actions, especially quantitative easing, played in creating today’s difficult conditions.
Articles represent the opinions of their writers, not necessarily those of the University of Chicago, the Booth School of Business, or its faculty.